
Monitors
24/7 uptime monitoring for your servicesEdit
Monitors check your services on a schedule and alert you when they fail. Track availability and response time, then investigate failed checks.
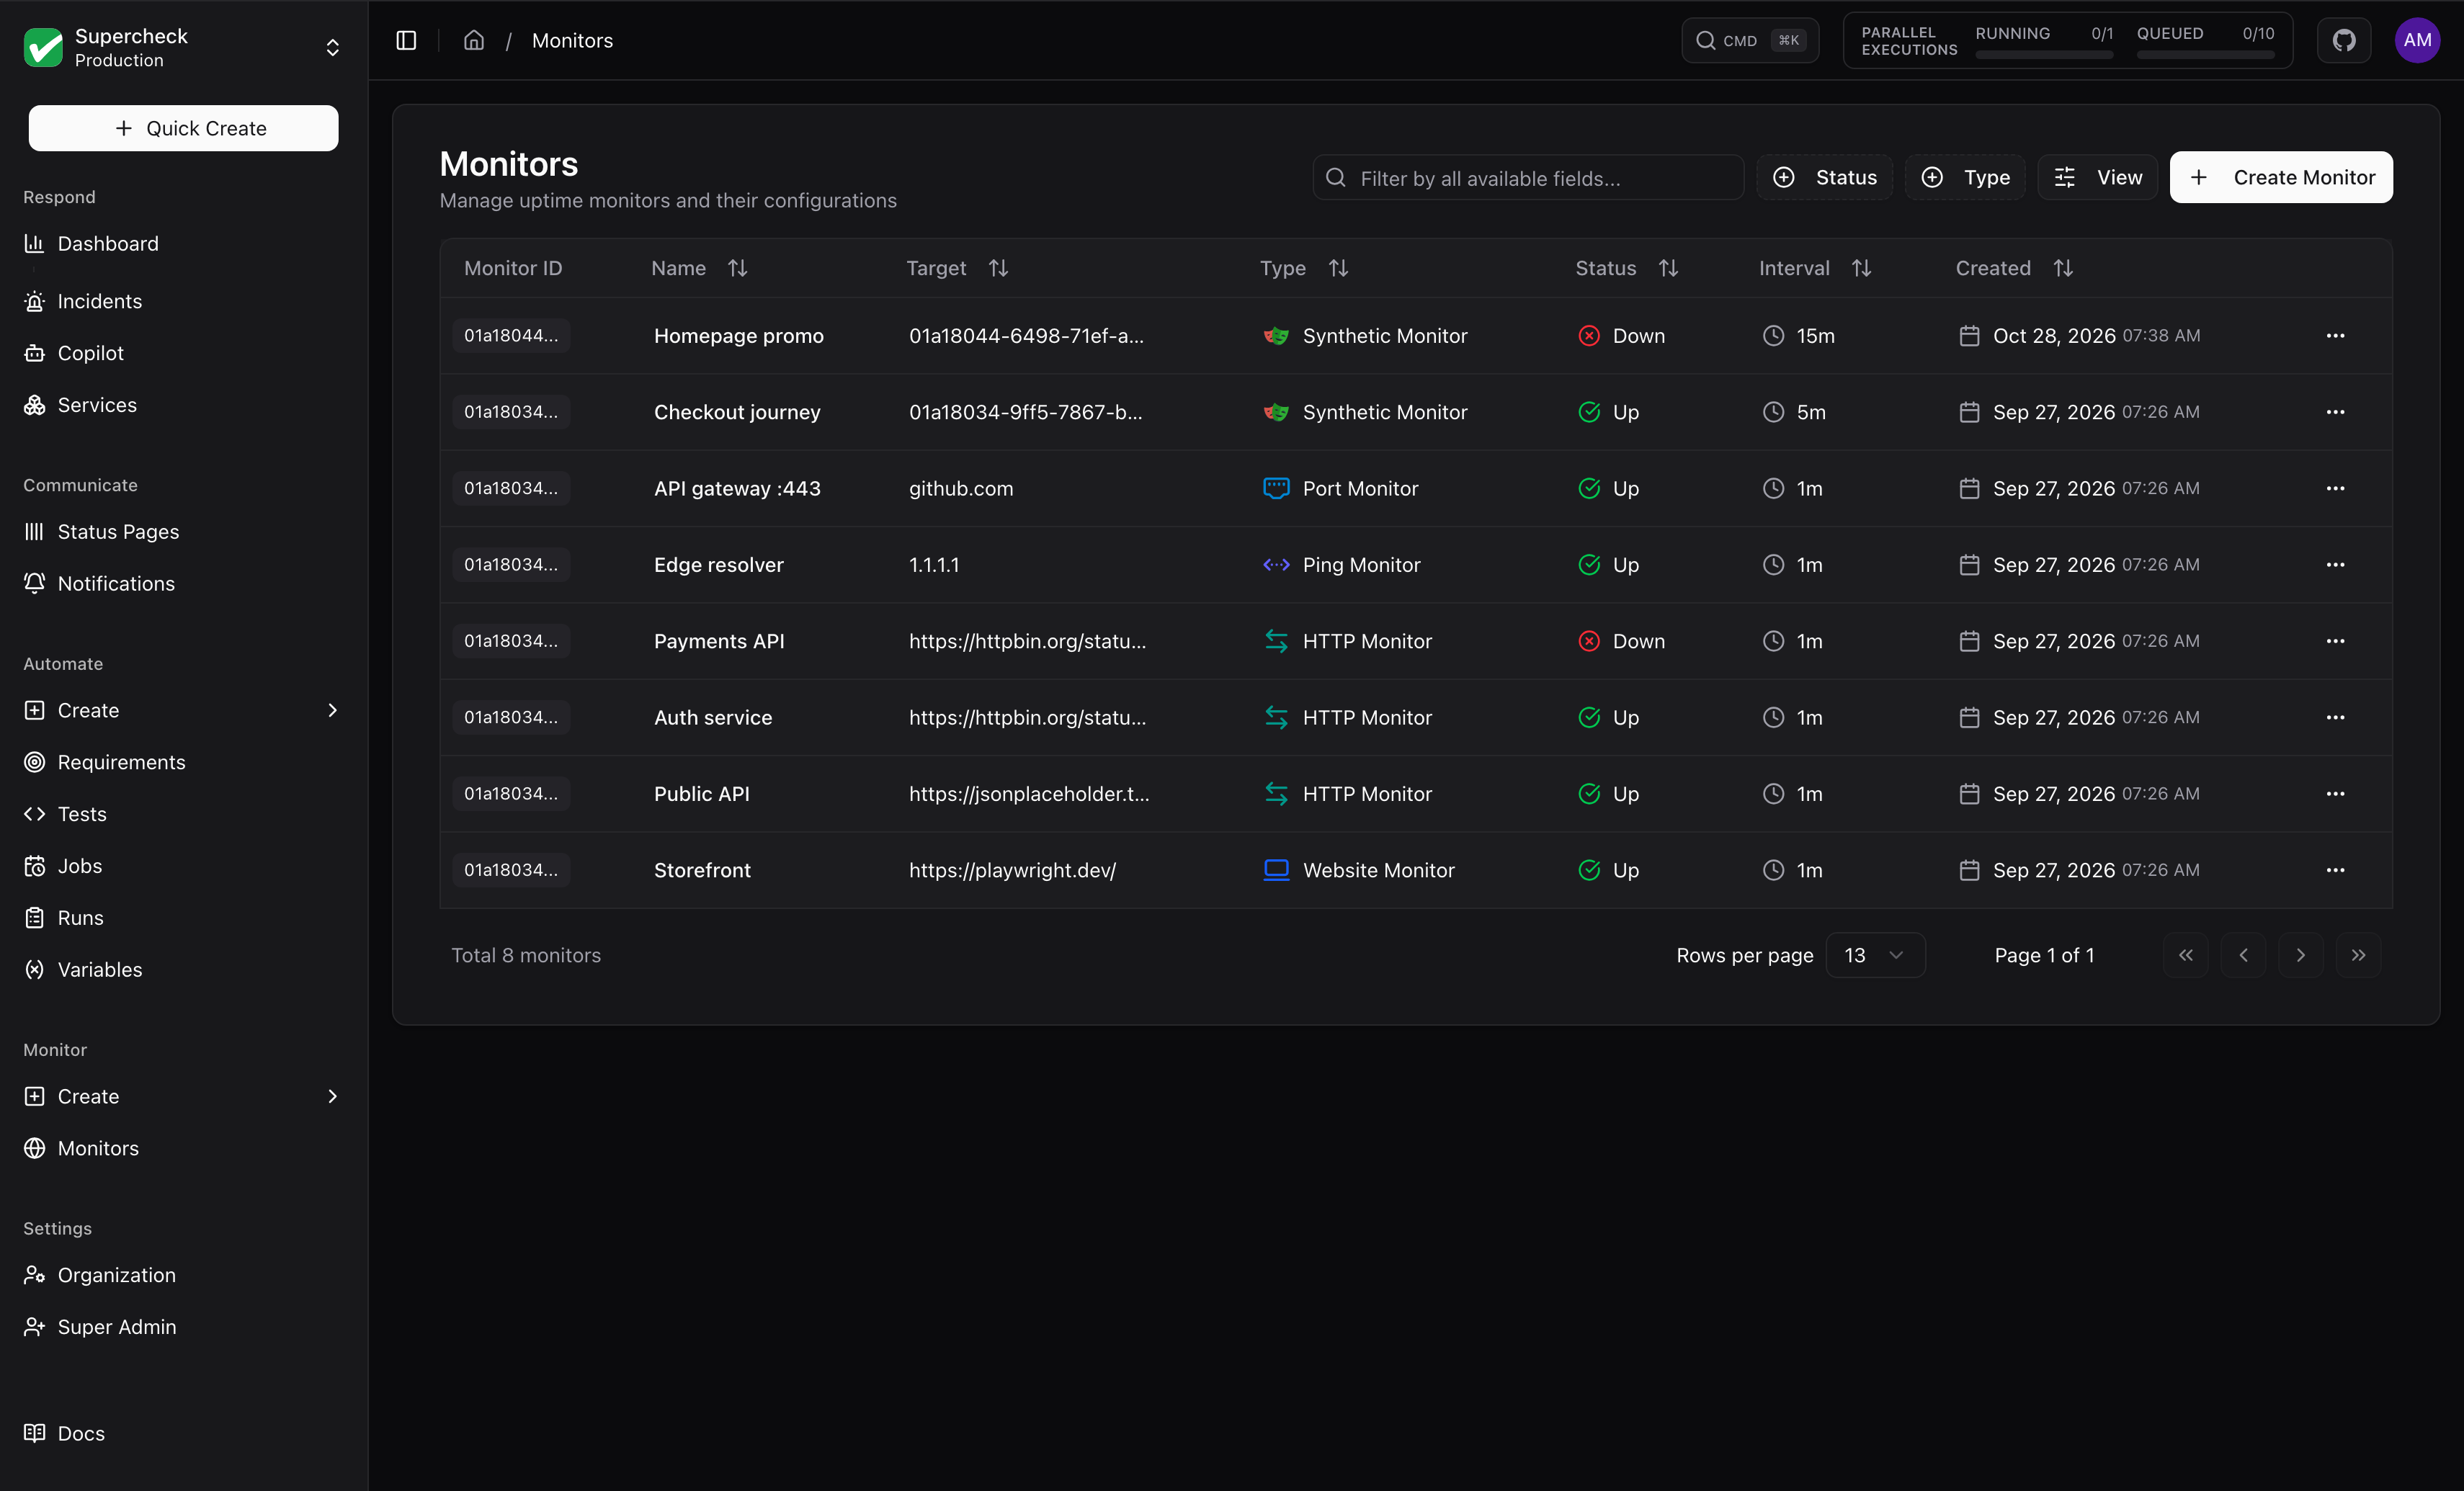
Setup Workflow
Scroll horizontally on smaller screens to view all steps.
Monitor Types
Choose a type from Monitor → Create in the sidebar:
HTTP Monitor
Full-featured API and endpoint monitoring with custom headers, authentication, and response validation
Website Monitor
Simple website availability checks with SSL certificate expiration tracking
Ping Monitor
TCP reachability checks on ports 443/80 for server availability
Port Monitor
TCP/UDP port checks to verify that specific services are accepting connections
Synthetic Monitor
Run full Playwright browser tests on a schedule to validate complete user journeys
Creating an HTTP, website, ping or port monitor returns 400 when the target is a private, loopback or reserved address, including a hostname that resolves to one. Changing the type or target of an existing monitor is checked the same way; updates that leave both unchanged are not. Instances can allow these with ALLOW_INTERNAL_TARGETS=true (see Optional configuration); unlike webhook channels, monitors do not also need SELF_HOSTED=true. Cloud metadata and link-local addresses such as 169.254.169.254 stay blocked even then.
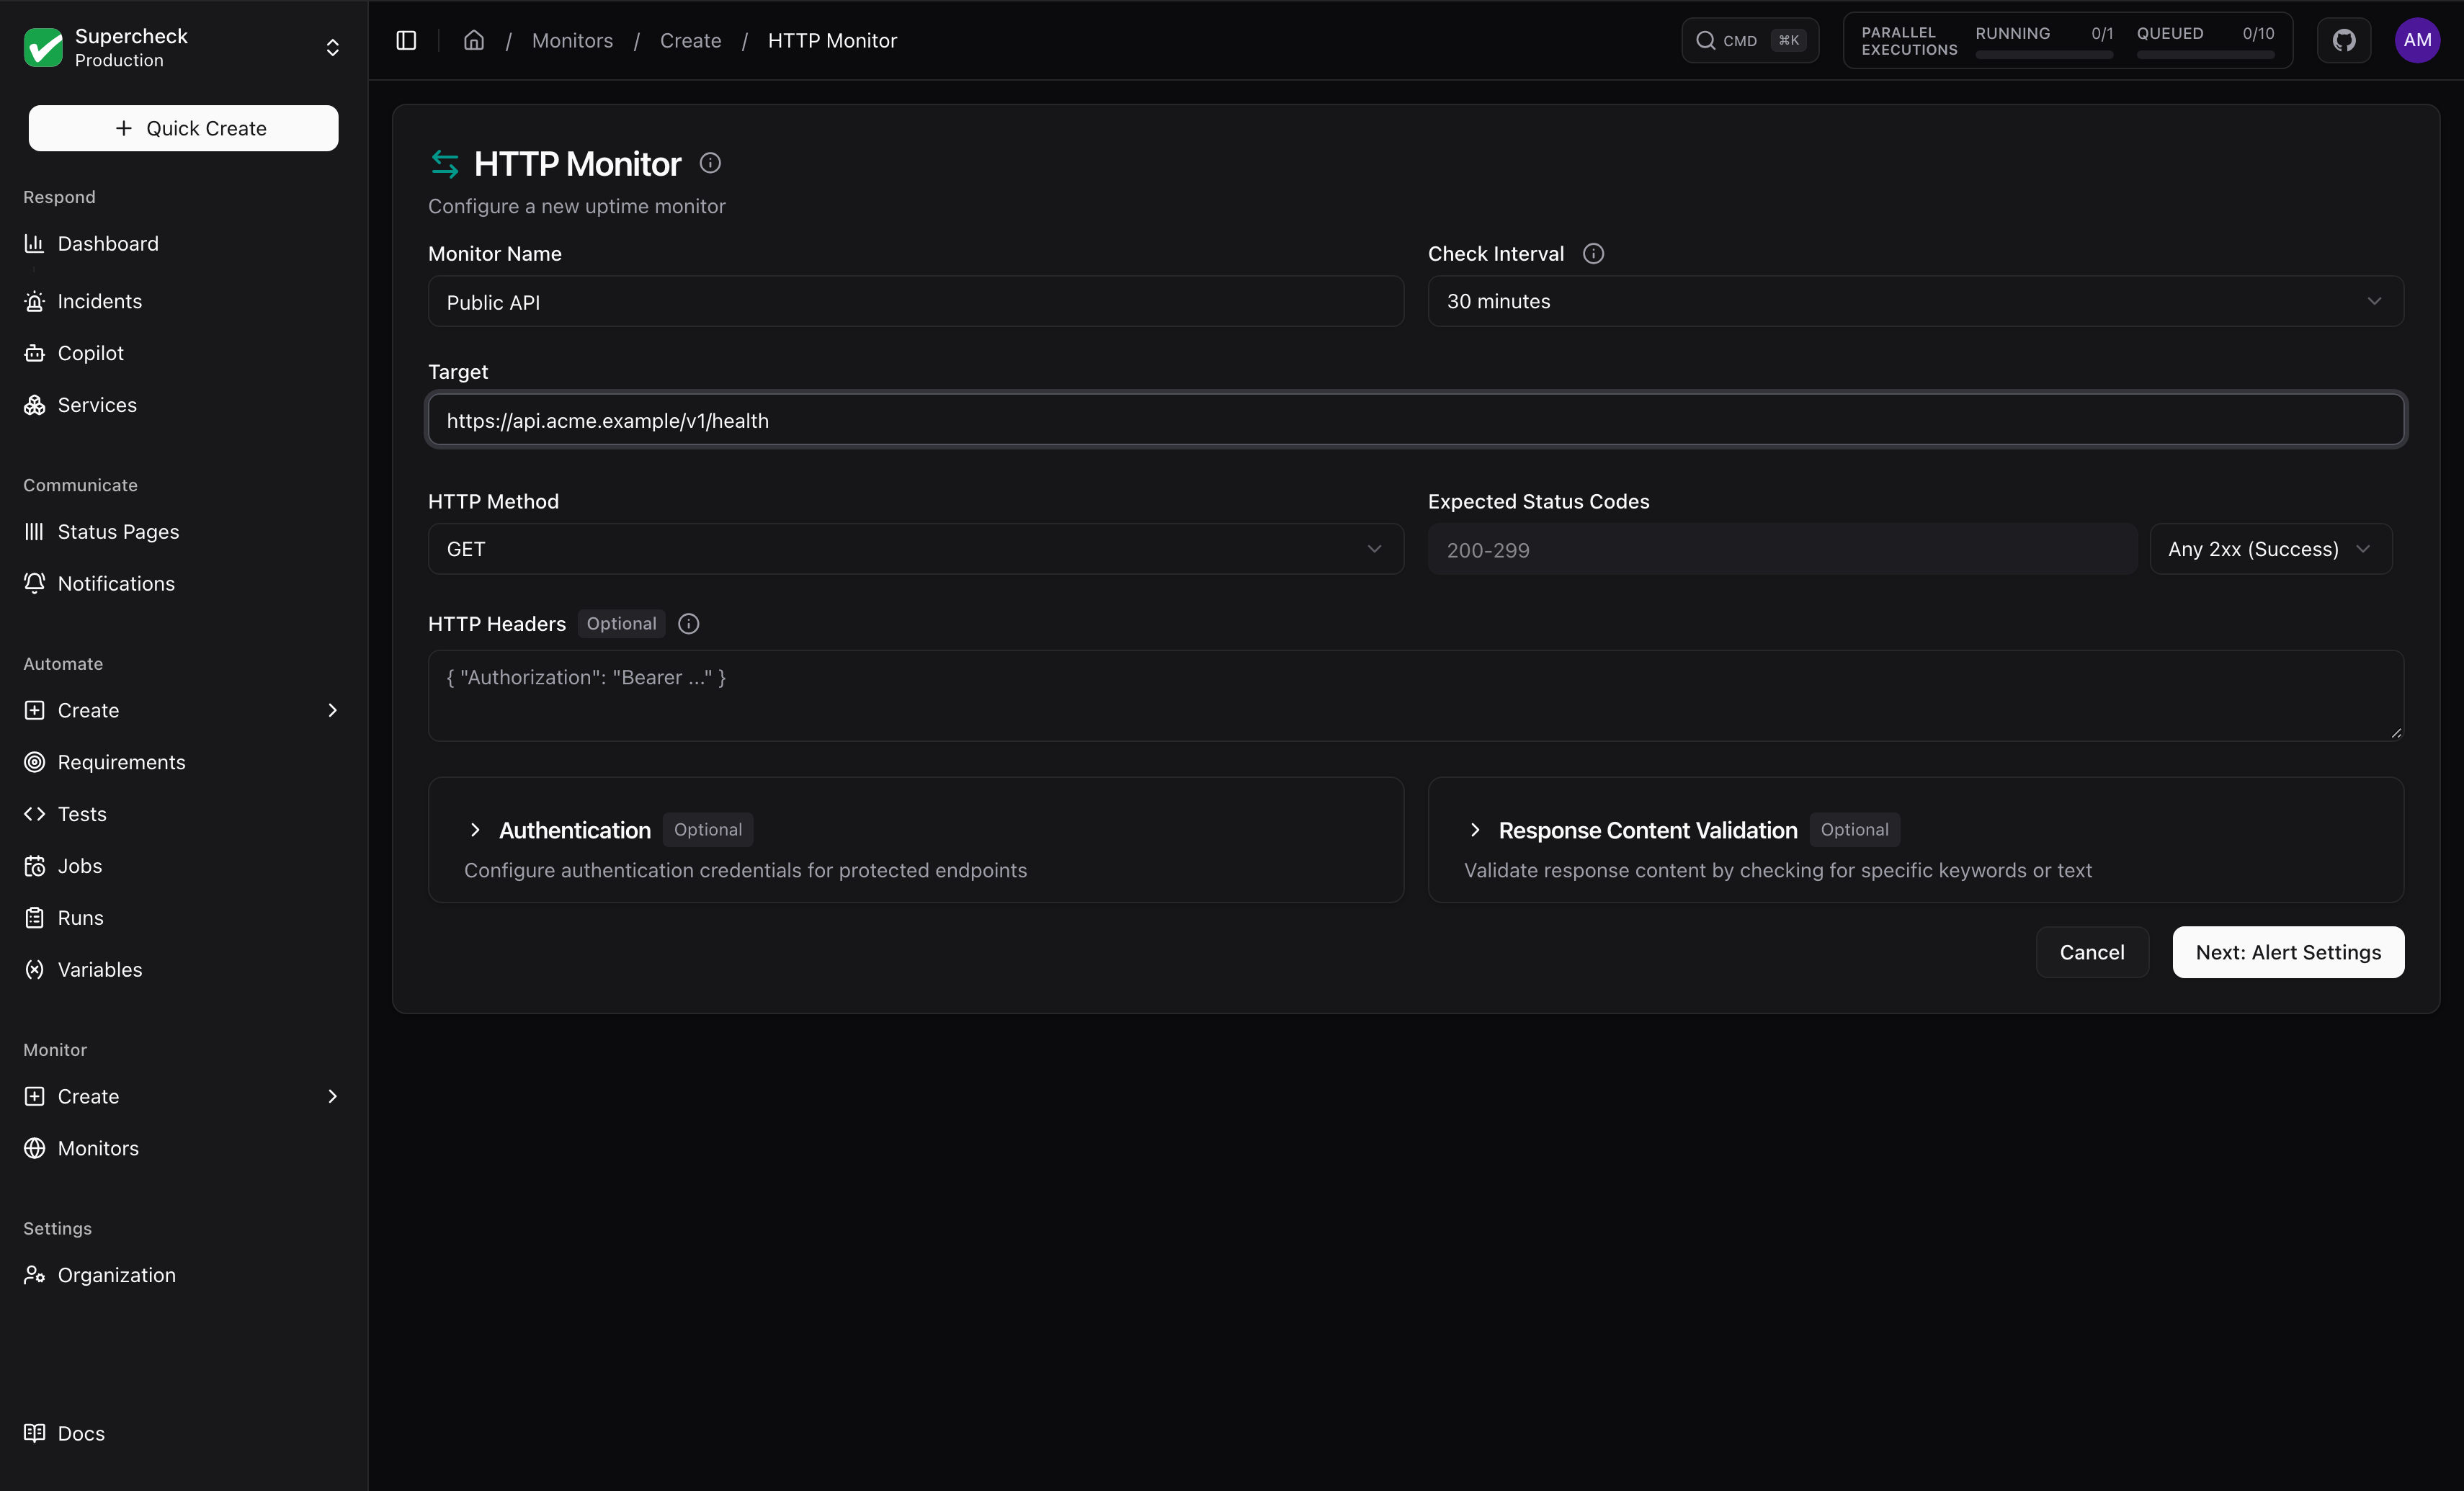
HTTP Monitor
Checks availability, status code, response time and body content of APIs and web services.
| Option | Details |
|---|---|
| HTTP Method | GET, POST, PUT, DELETE, PATCH, HEAD, OPTIONS |
| Custom Headers | Tokens, API keys, any header |
| Request Body | JSON or form data for POST/PUT |
| Authentication | Basic Auth or Bearer Token |
| Expected Status | Codes (200), ranges (200-299) or classes (2xx), comma-separated. Malformed entries are rejected when you save; a stored malformed entry never matches |
| Keyword Validation | Text must be present or absent in the response |
Website Monitor
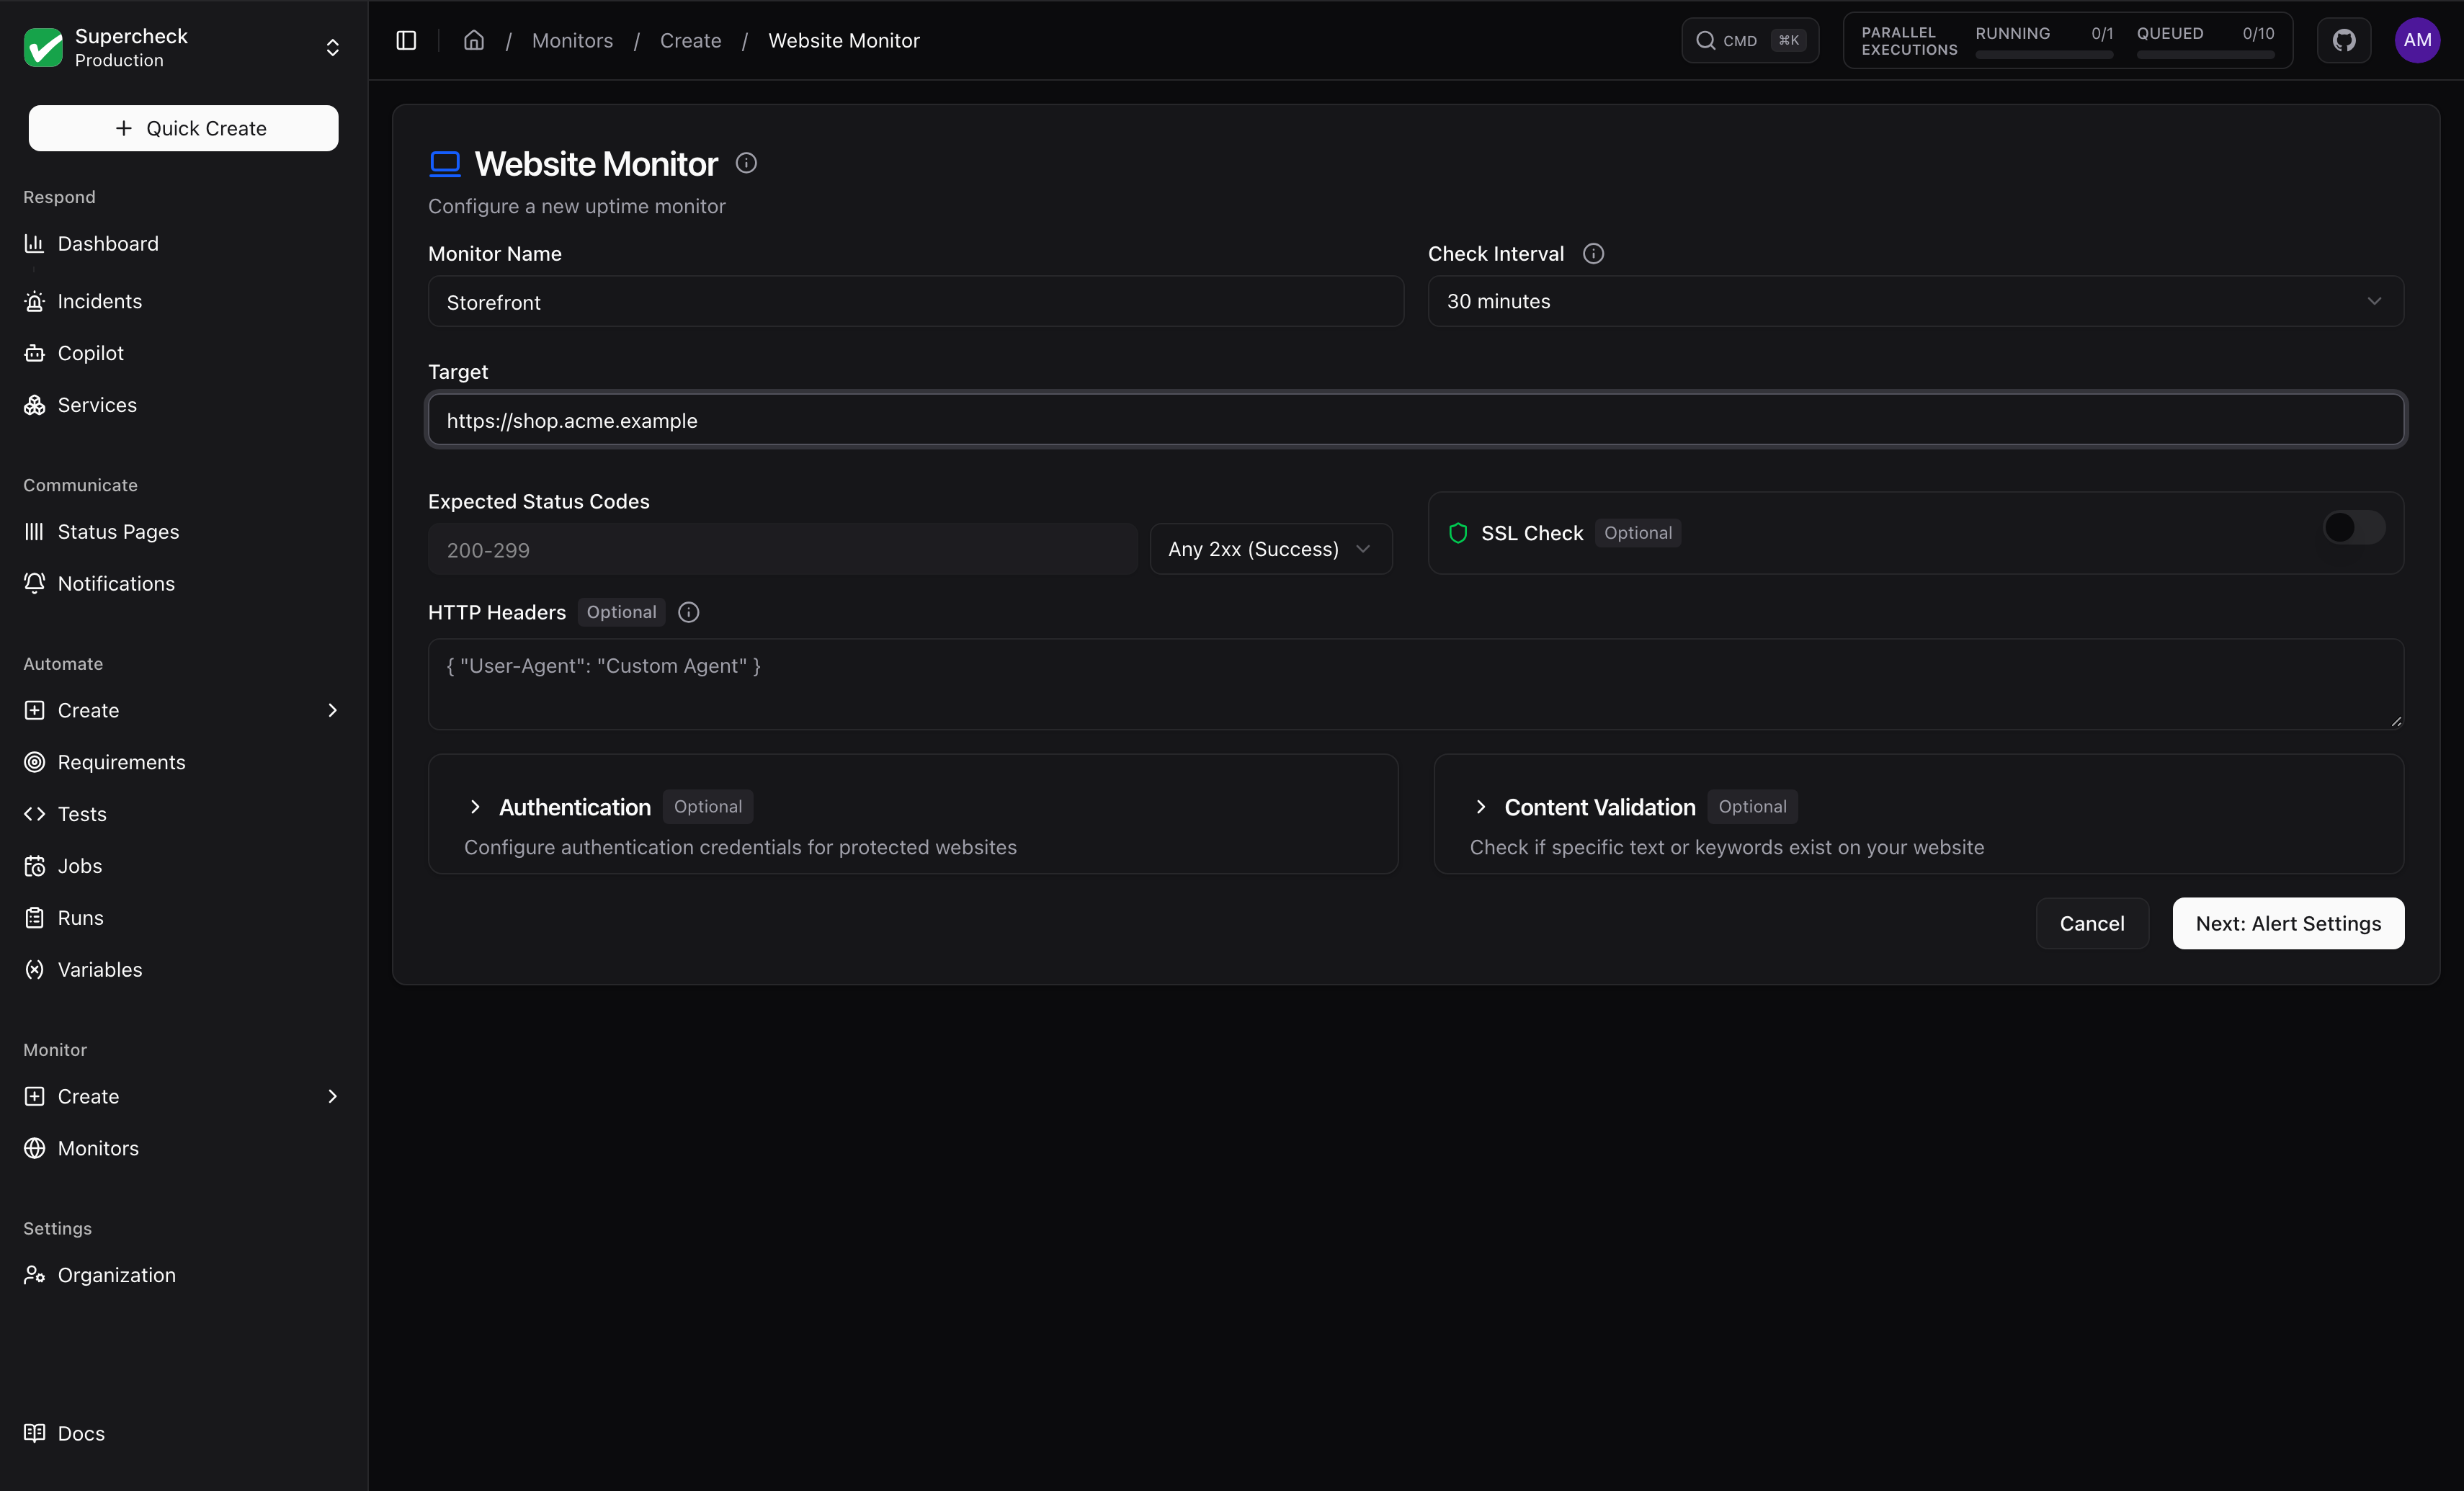
Web page availability with built-in SSL tracking, for marketing sites, landing pages and public apps.
| Checks | Details |
|---|---|
| Status | Expected status code (2xx by default) |
| SSL | Certificate is valid; expiration date |
| Keyword | Optional text on the page |
The SSL Check toggle appears only when the target starts with https:// (an http:// target has no certificate). A monitor that already has it on keeps showing it, so you can turn it off.
With SSL Check on (HTTPS targets only):
| Situation | What happens |
|---|---|
| Certificate is valid | Read every 24 hours by default; every 6 hours near the warning window; hourly inside it |
| Expired, not yet valid, untrusted or wrong hostname | Check is down; re-read on every check until fixed |
| Certificate can't be read (timeout, reset) | Check stays up and retries next check; if the site stays up, an SSL alert is sent after 24 hours |
| Certificate renewed after an SSL warning | One SSL certificate renewed notice is sent on the next successful read |
| SSL Check just turned on, or target changed | Monitor page shows No certificate data yet until the next check |
Website monitors accept custom headers and Basic or Bearer authentication. The form always sends GET with no request body; use an HTTP monitor to send another method or a body.
Ping Monitor
TCP reachability and connection latency for hosts without an HTTP endpoint, on port 443 or 80. Suited to servers, network infrastructure and VPN endpoints; the host must be reachable from the worker.
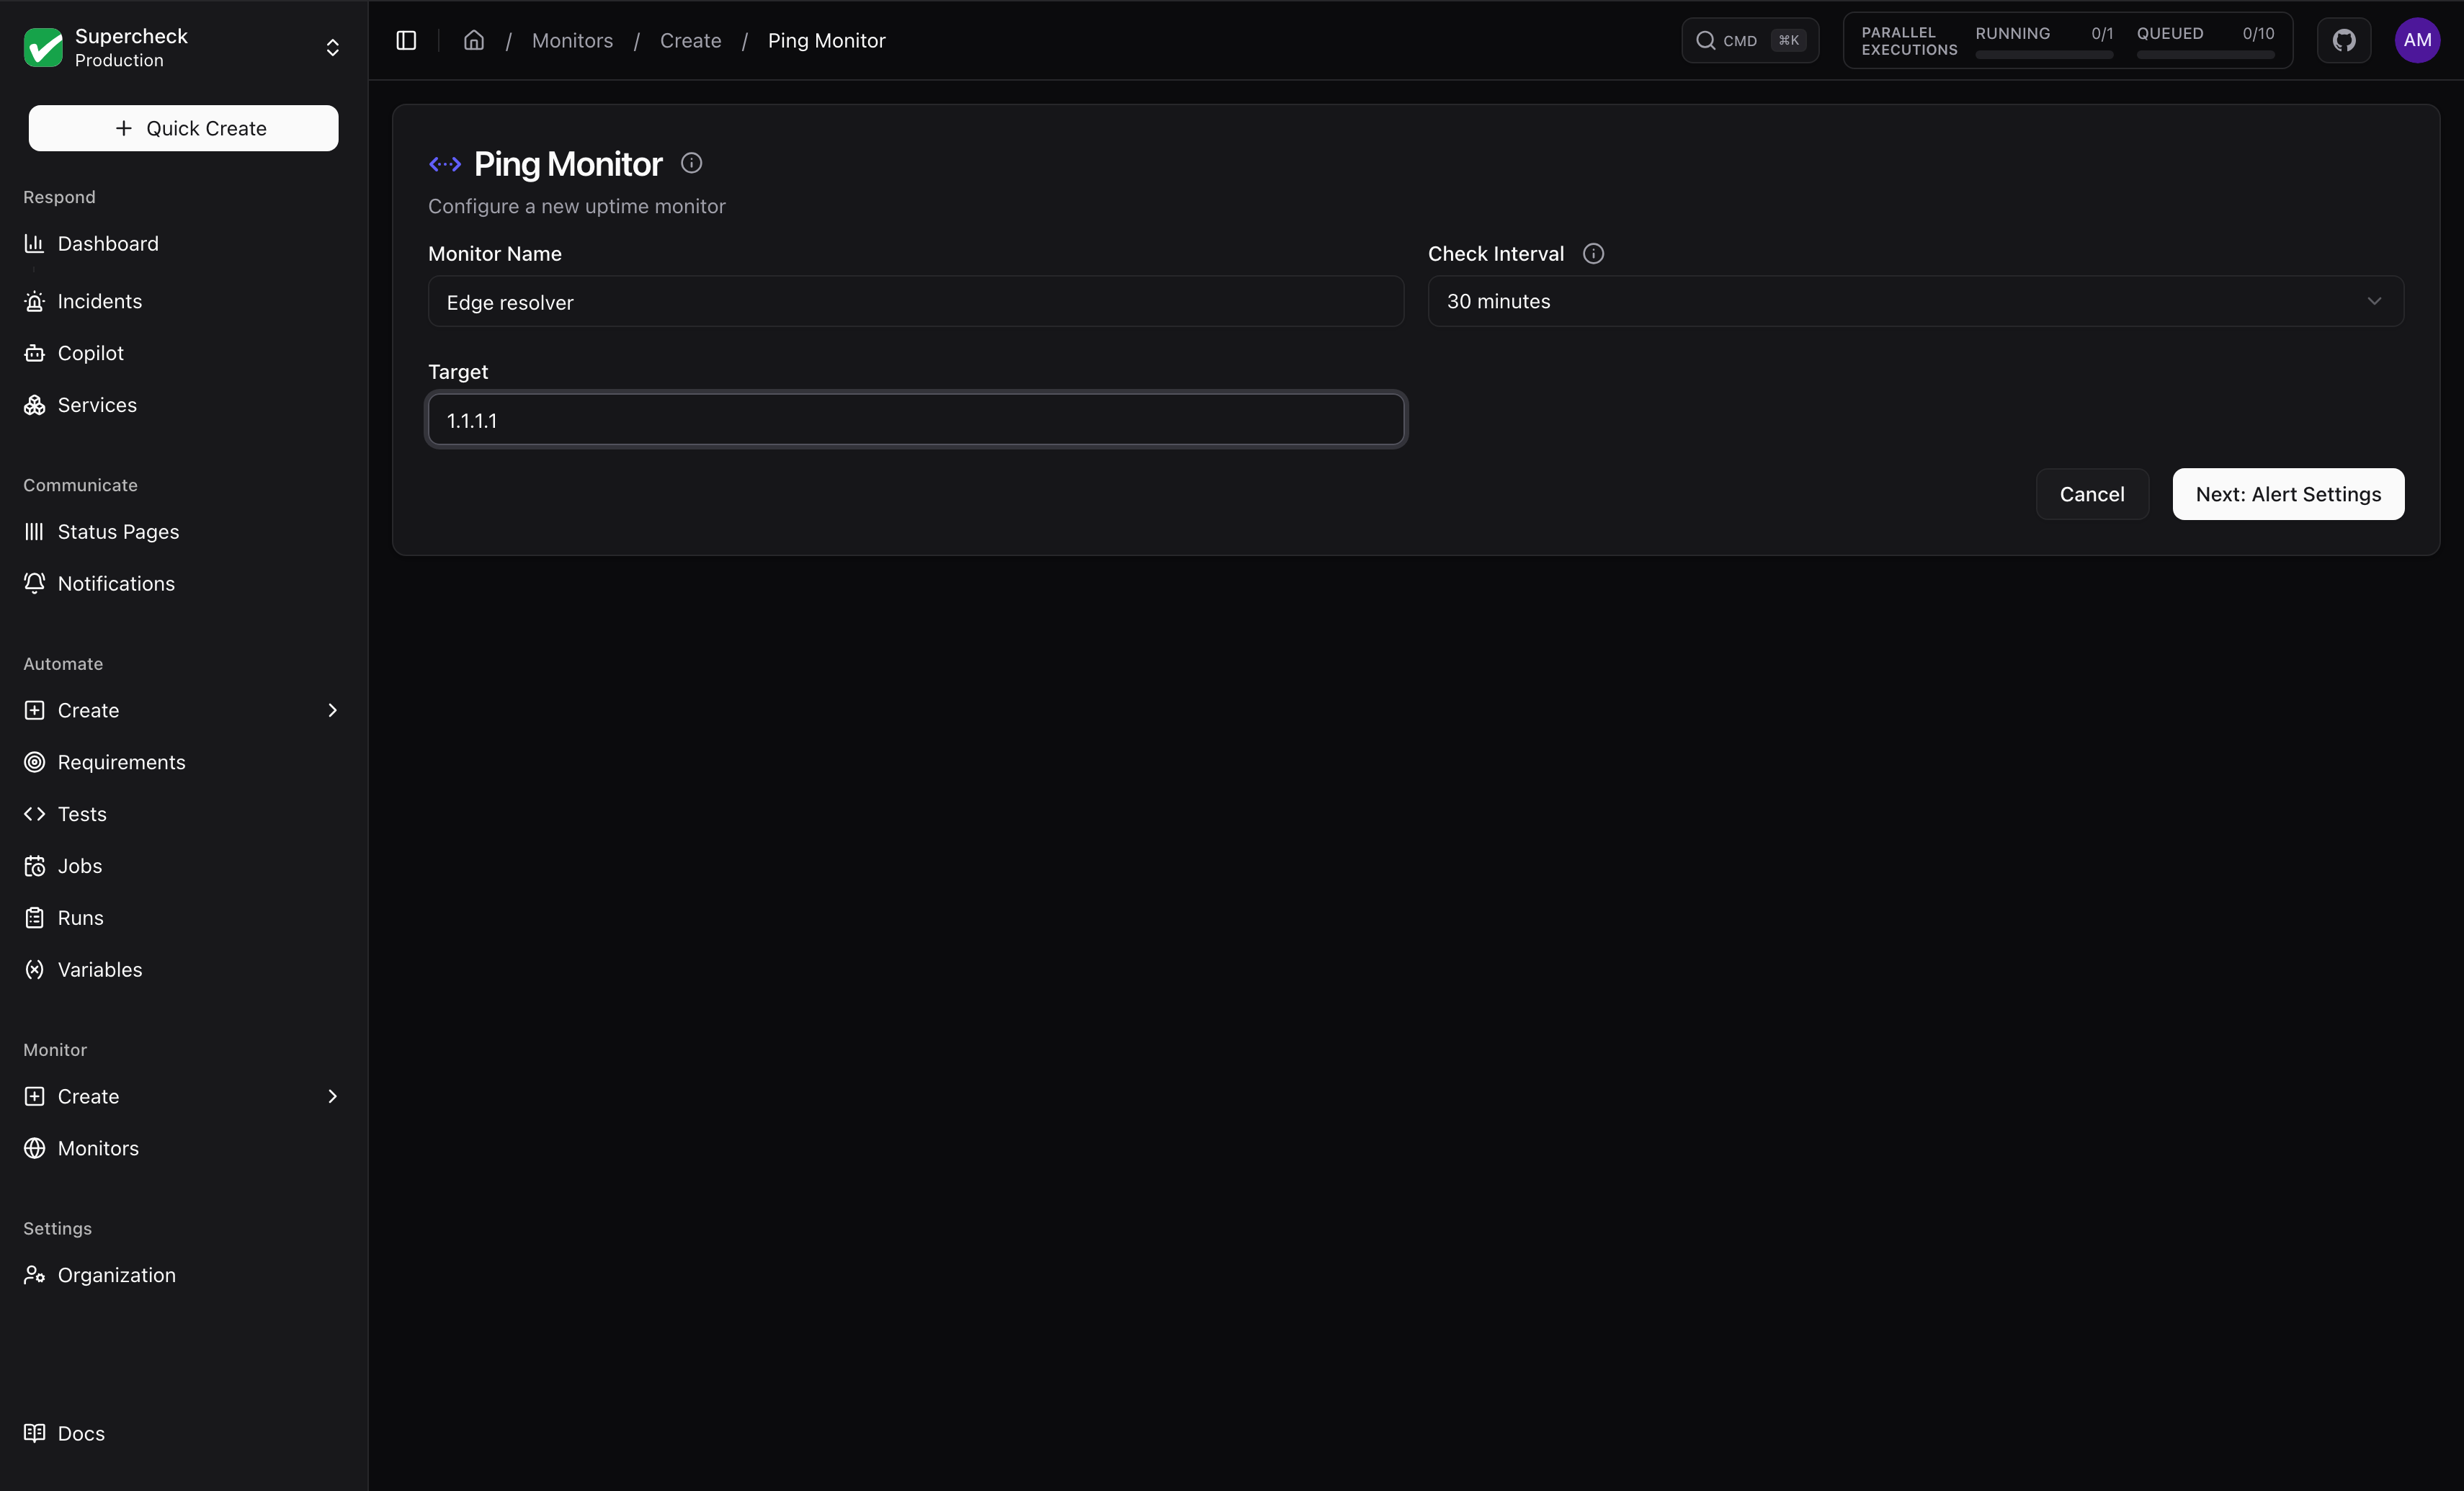
Ping monitors use TCP connectivity on ports 443 and 80 rather than ICMP. The check is up when either port accepts or refuses the connection (a refusal means the host answered), and down only when neither answers. The reported response time is that of the attempt that answered.
Port Monitor
Verifies that a TCP or UDP port accepts connections within the timeout, for example databases (5432, 3306), caches (6379, 11211), mail (25, 587, 993) or custom services.
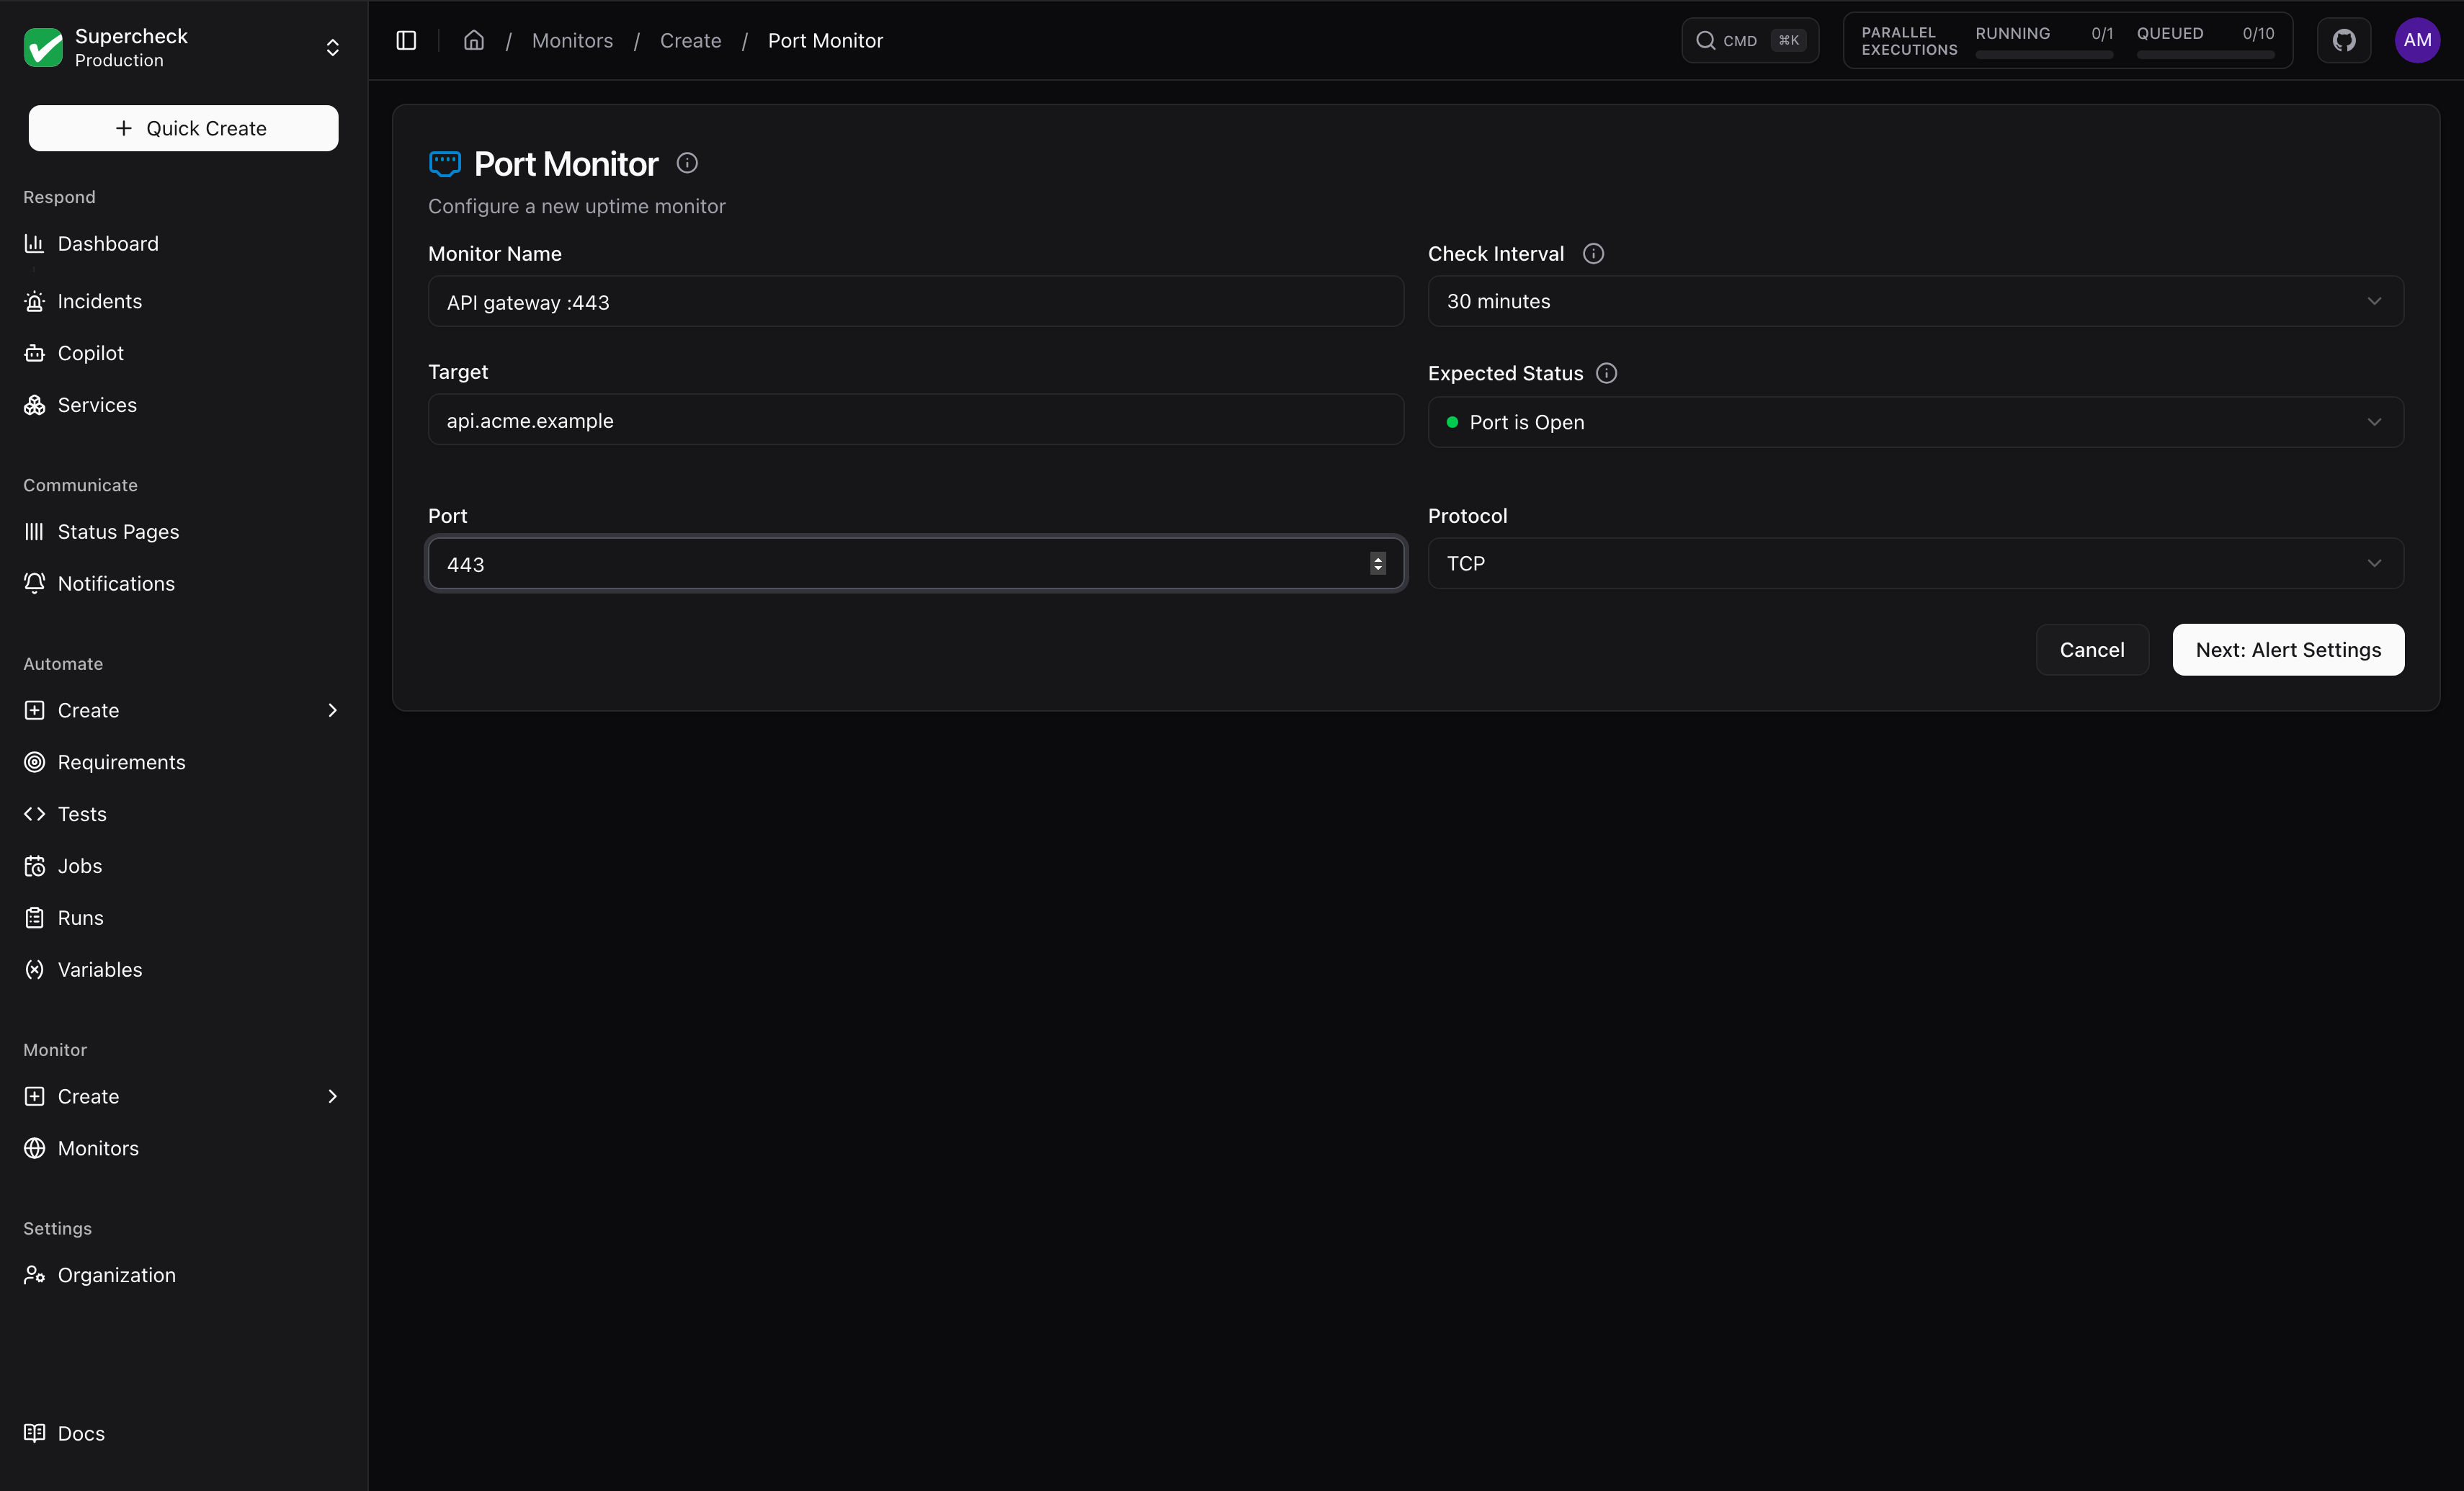
TCP: with Expect closed a refused connection passes. A timeout also passes, because a firewalled port drops packets, but only if the host still answers on port 443 or 80; an unreachable host fails. A DNS failure is always down.
UDP: UDP has no handshake. The worker sends one packet and waits up to two seconds. A reply proves the port open and a refusal proves it closed; only silence is ambiguous:
| Outcome | Result |
|---|---|
| Service replies | Up (open) |
| ICMP port-unreachable (connection refused) | Down, closed (passes with Expect closed) |
| Silence | Up, reported as open or filtered; fails Expect closed |
Many UDP services never reply, and a firewall that drops packets looks the same as an open port, so silence is not proof the service works. Use TCP or an application-level check when you need response verification. Firewalls that do not return ICMP errors make closed ports look open.
Synthetic Monitor
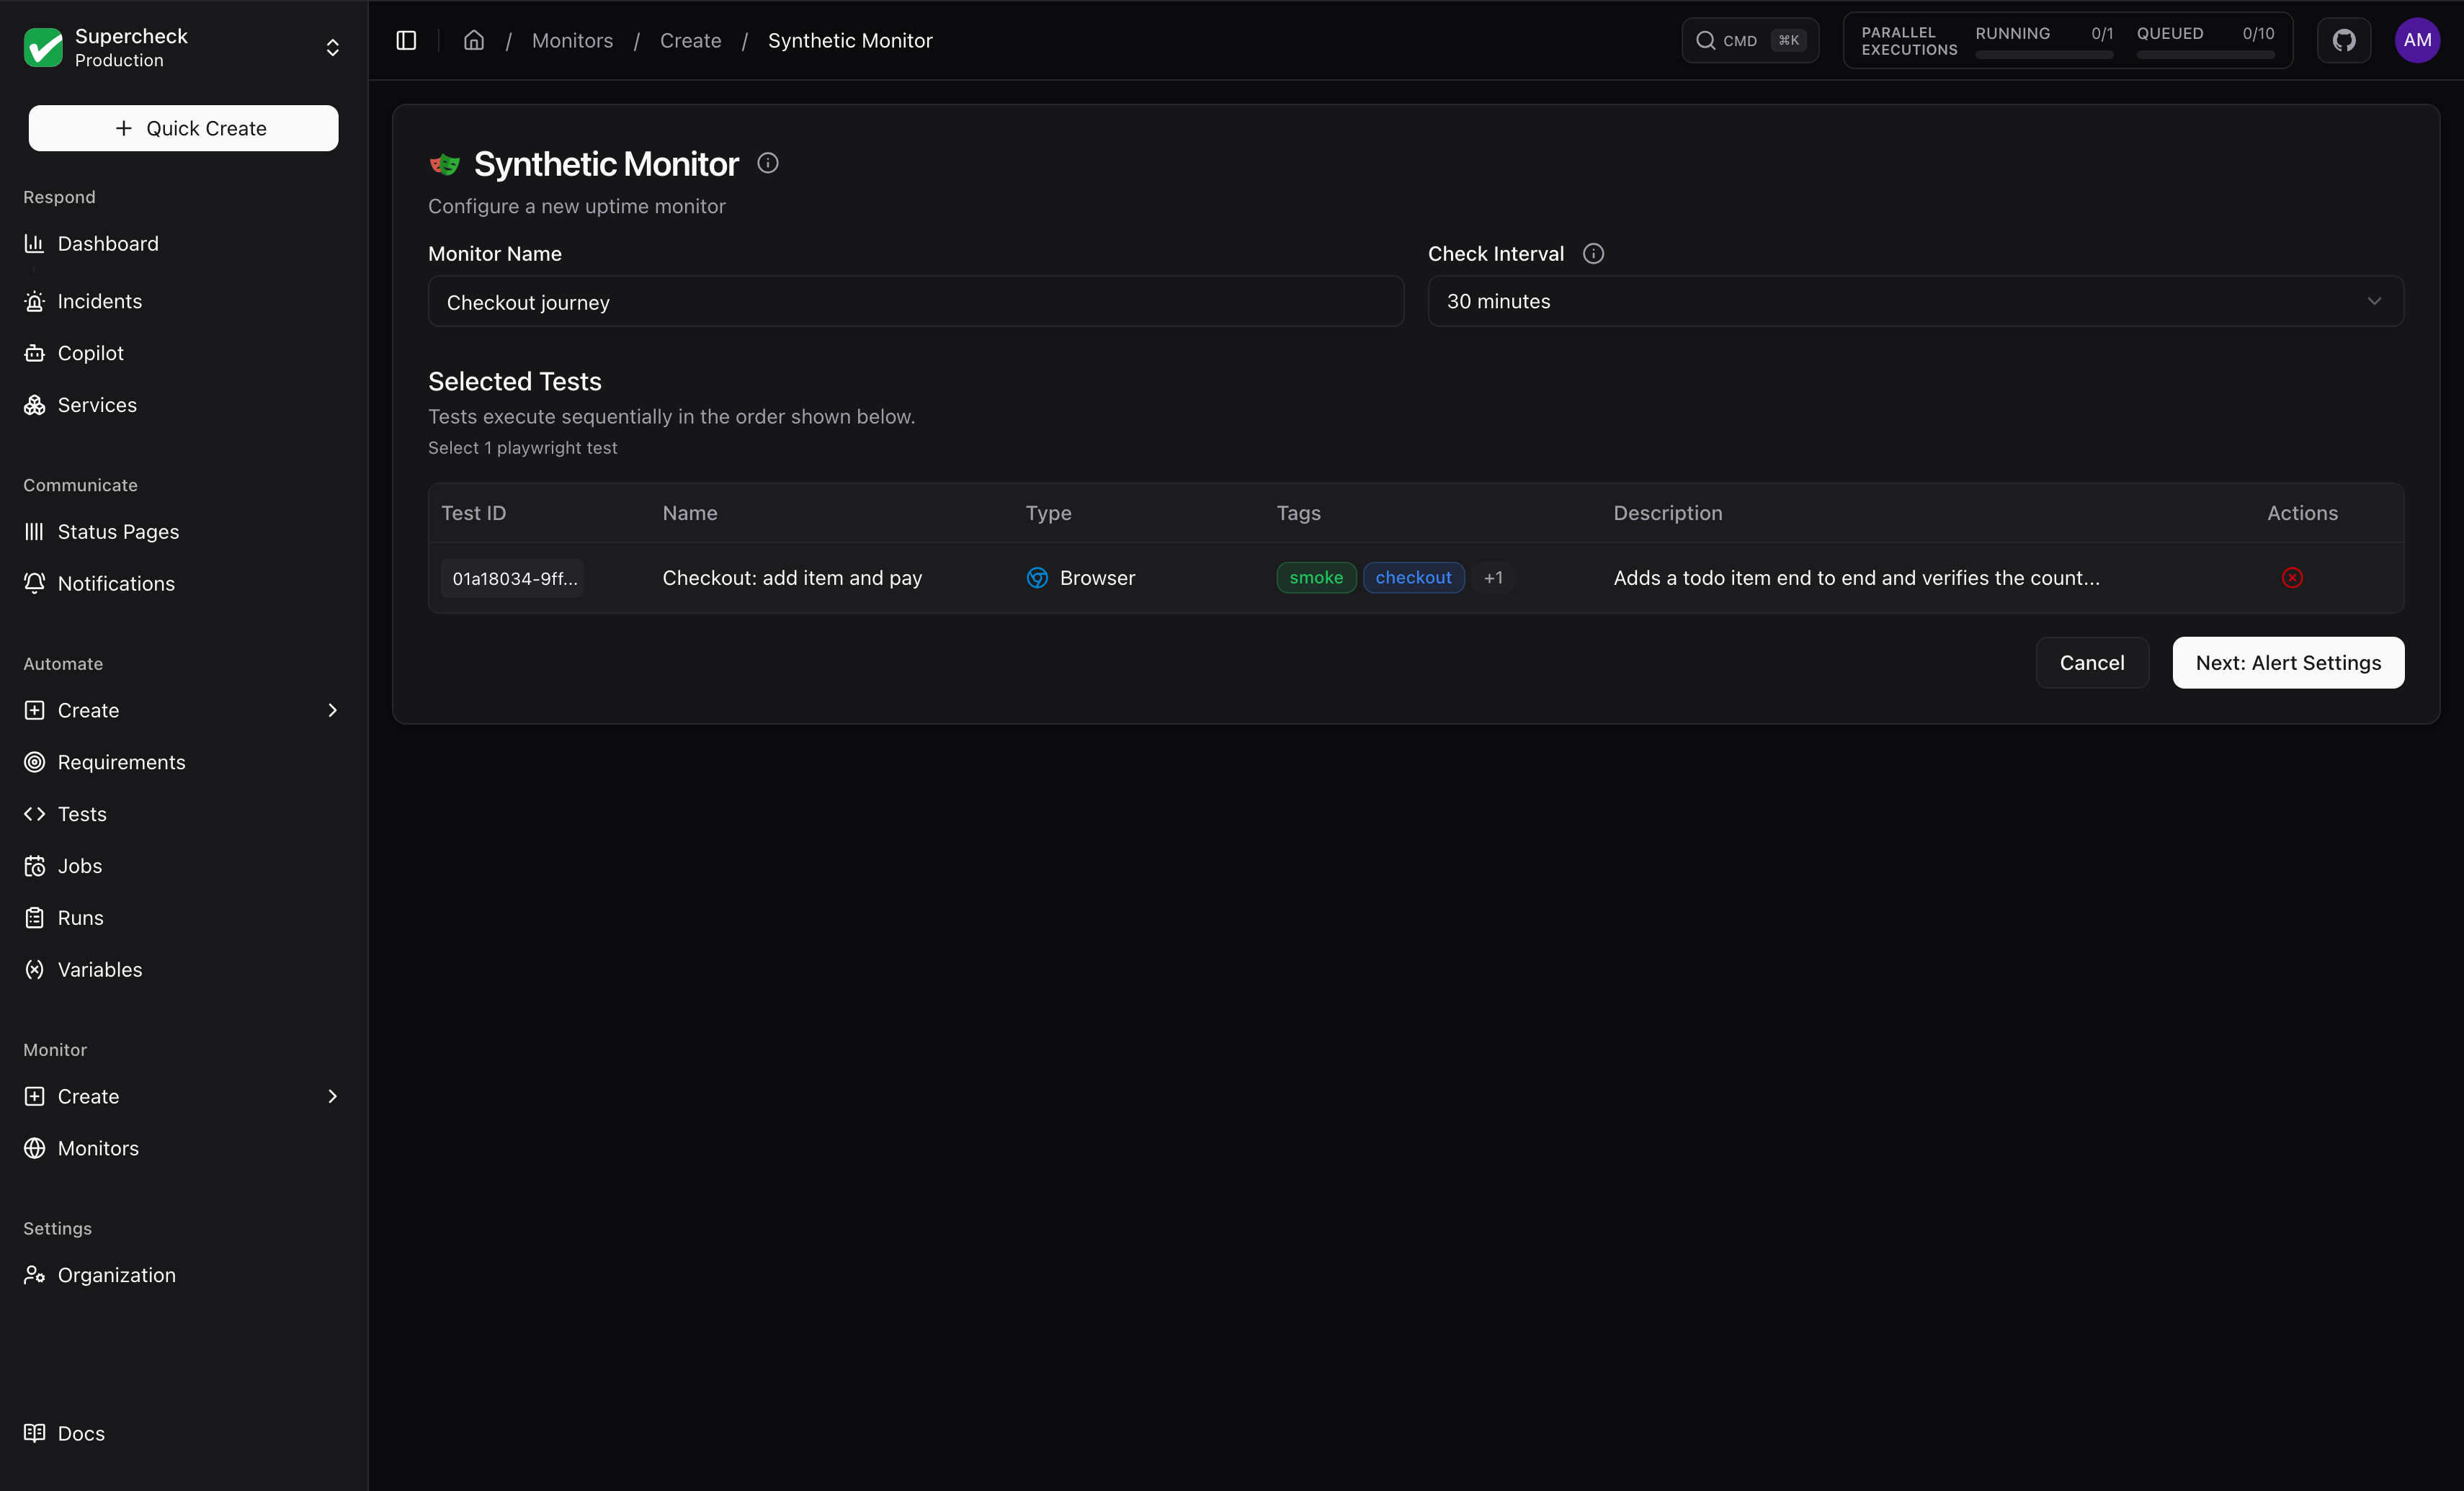
Runs a Playwright browser test on a schedule to validate full user journeys such as login, signup and checkout, including JavaScript-rendered pages and multi-step flows.
Create a Playwright test in the Playground and save it to your project.
Create a Synthetic Monitor and select the test.
Set the check interval (minimum 5 minutes). Supercheck runs the test and reports pass or fail.
Locations
Turn on Multi-Location Monitoring in the monitor form, then pick two or more Locations. With several locations, the Aggregation Strategy decides the monitor's overall status.
| Strategy | Monitor is Up when |
|---|---|
| All Locations Up | Every location is up |
| Majority Up (default) | More than 50% of locations are up |
| Any Location Up | At least one location is up |
Synthetic monitors can only use locations that allow browser execution; others are shown but disabled. See Super Admin for location settings.
Alert Configuration
Configure when and how you receive notifications about monitor status changes.
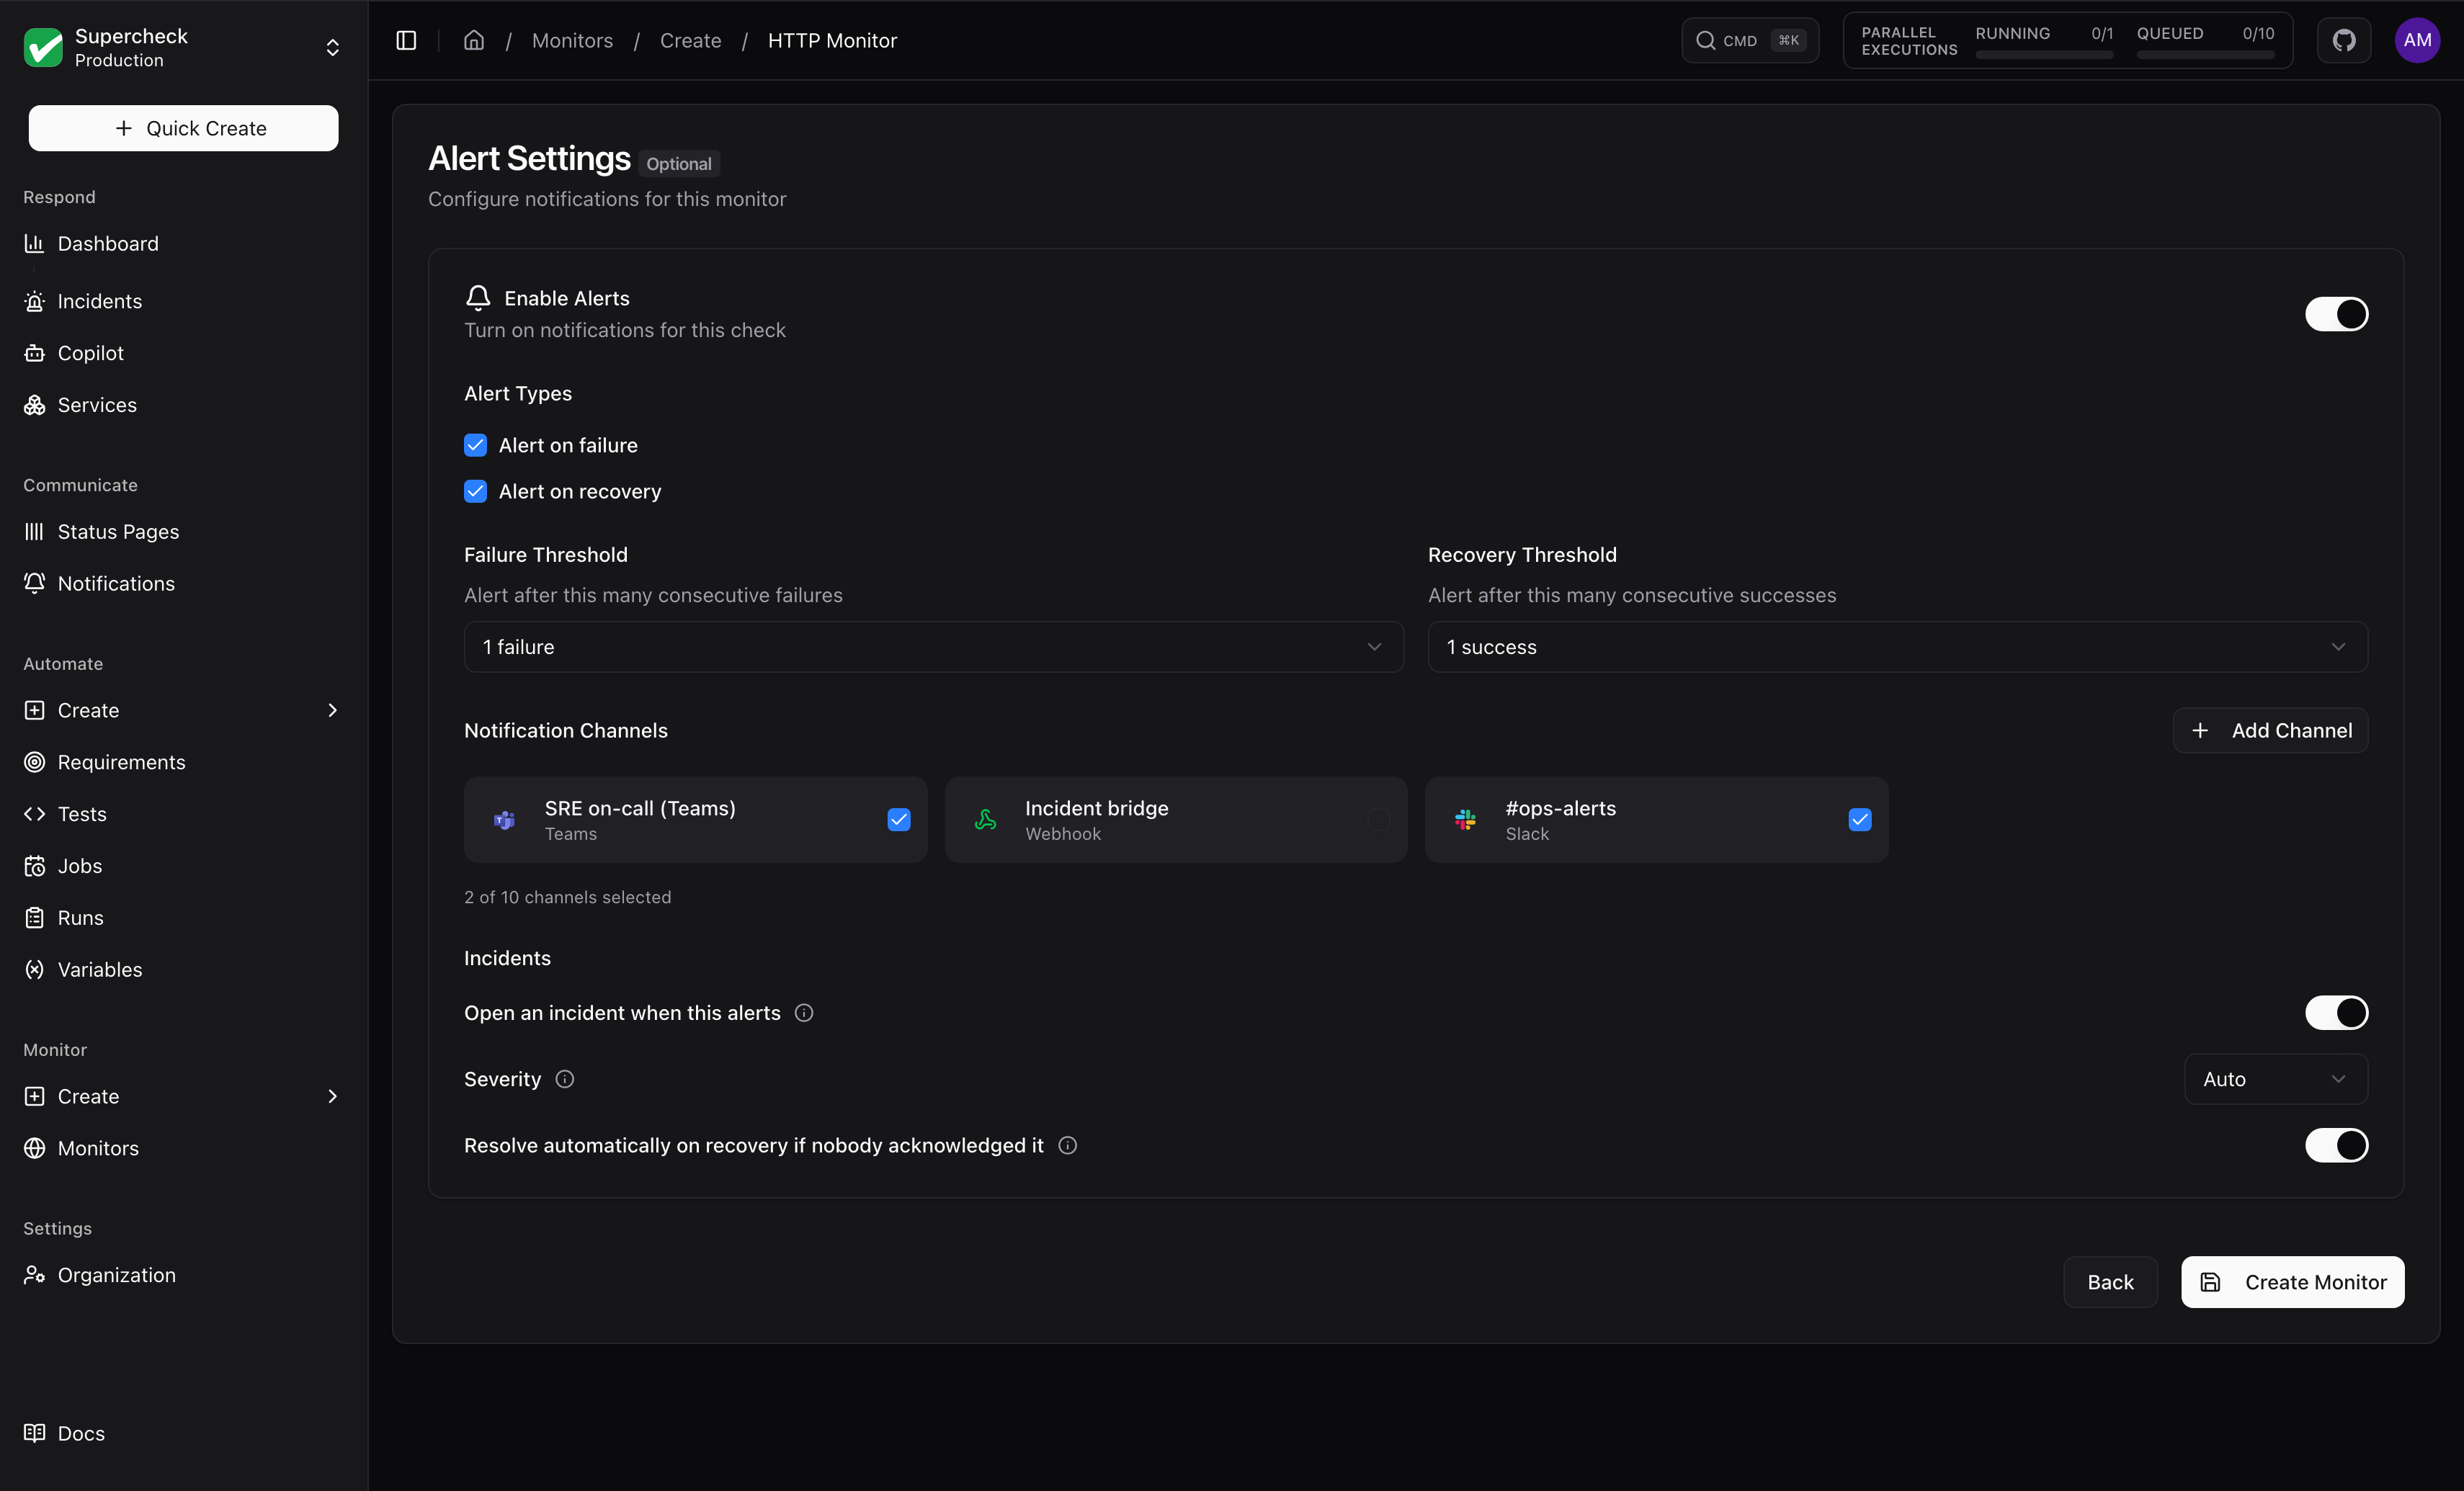
| Setting | What it does | Recommended |
|---|---|---|
| Enable Alerts | Turns notifications on or off for this monitor | On for production |
| Alert on Failure | At most 3 failure alerts per failure streak: the first when the failure threshold is reached, then reminders | On |
| Alert on Recovery | One alert per outage once the recovery threshold is reached | On for critical services |
| Failure Threshold | Consecutive failures before the first alert (1–5 in the app; API: 1–100) | 2–3 |
| Recovery Threshold | Consecutive healthy checks before the recovery alert (1–5 in the app; API: 1–100) | 2 |
| Alert on SSL certificate expiration | Shown only for website monitors with SSL Check on. Warns when a certificate is within the days set in the monitor's Alert in N days field (1–365, default 30), at most once per 24 hours | On |
| Notification Channels | Where alerts are sent. Channels linked through the notifications API appear here too, and linking or unlinking one through the API updates this list | More than one for critical services |
Incidents (in the same Alert Settings):
| Setting | What it does | Default |
|---|---|---|
| Open an incident when this alerts | Opens an incident, or joins the open one for this monitor | On |
| Severity | Auto derives SEV1 to SEV4 from the alert, or pick a fixed level | Auto |
| Resolve automatically on recovery if nobody acknowledged it | Resolves the incident when the monitor recovers, even if recovery alerts are off | On |
See How alerts become incidents.
Monitor Details Page
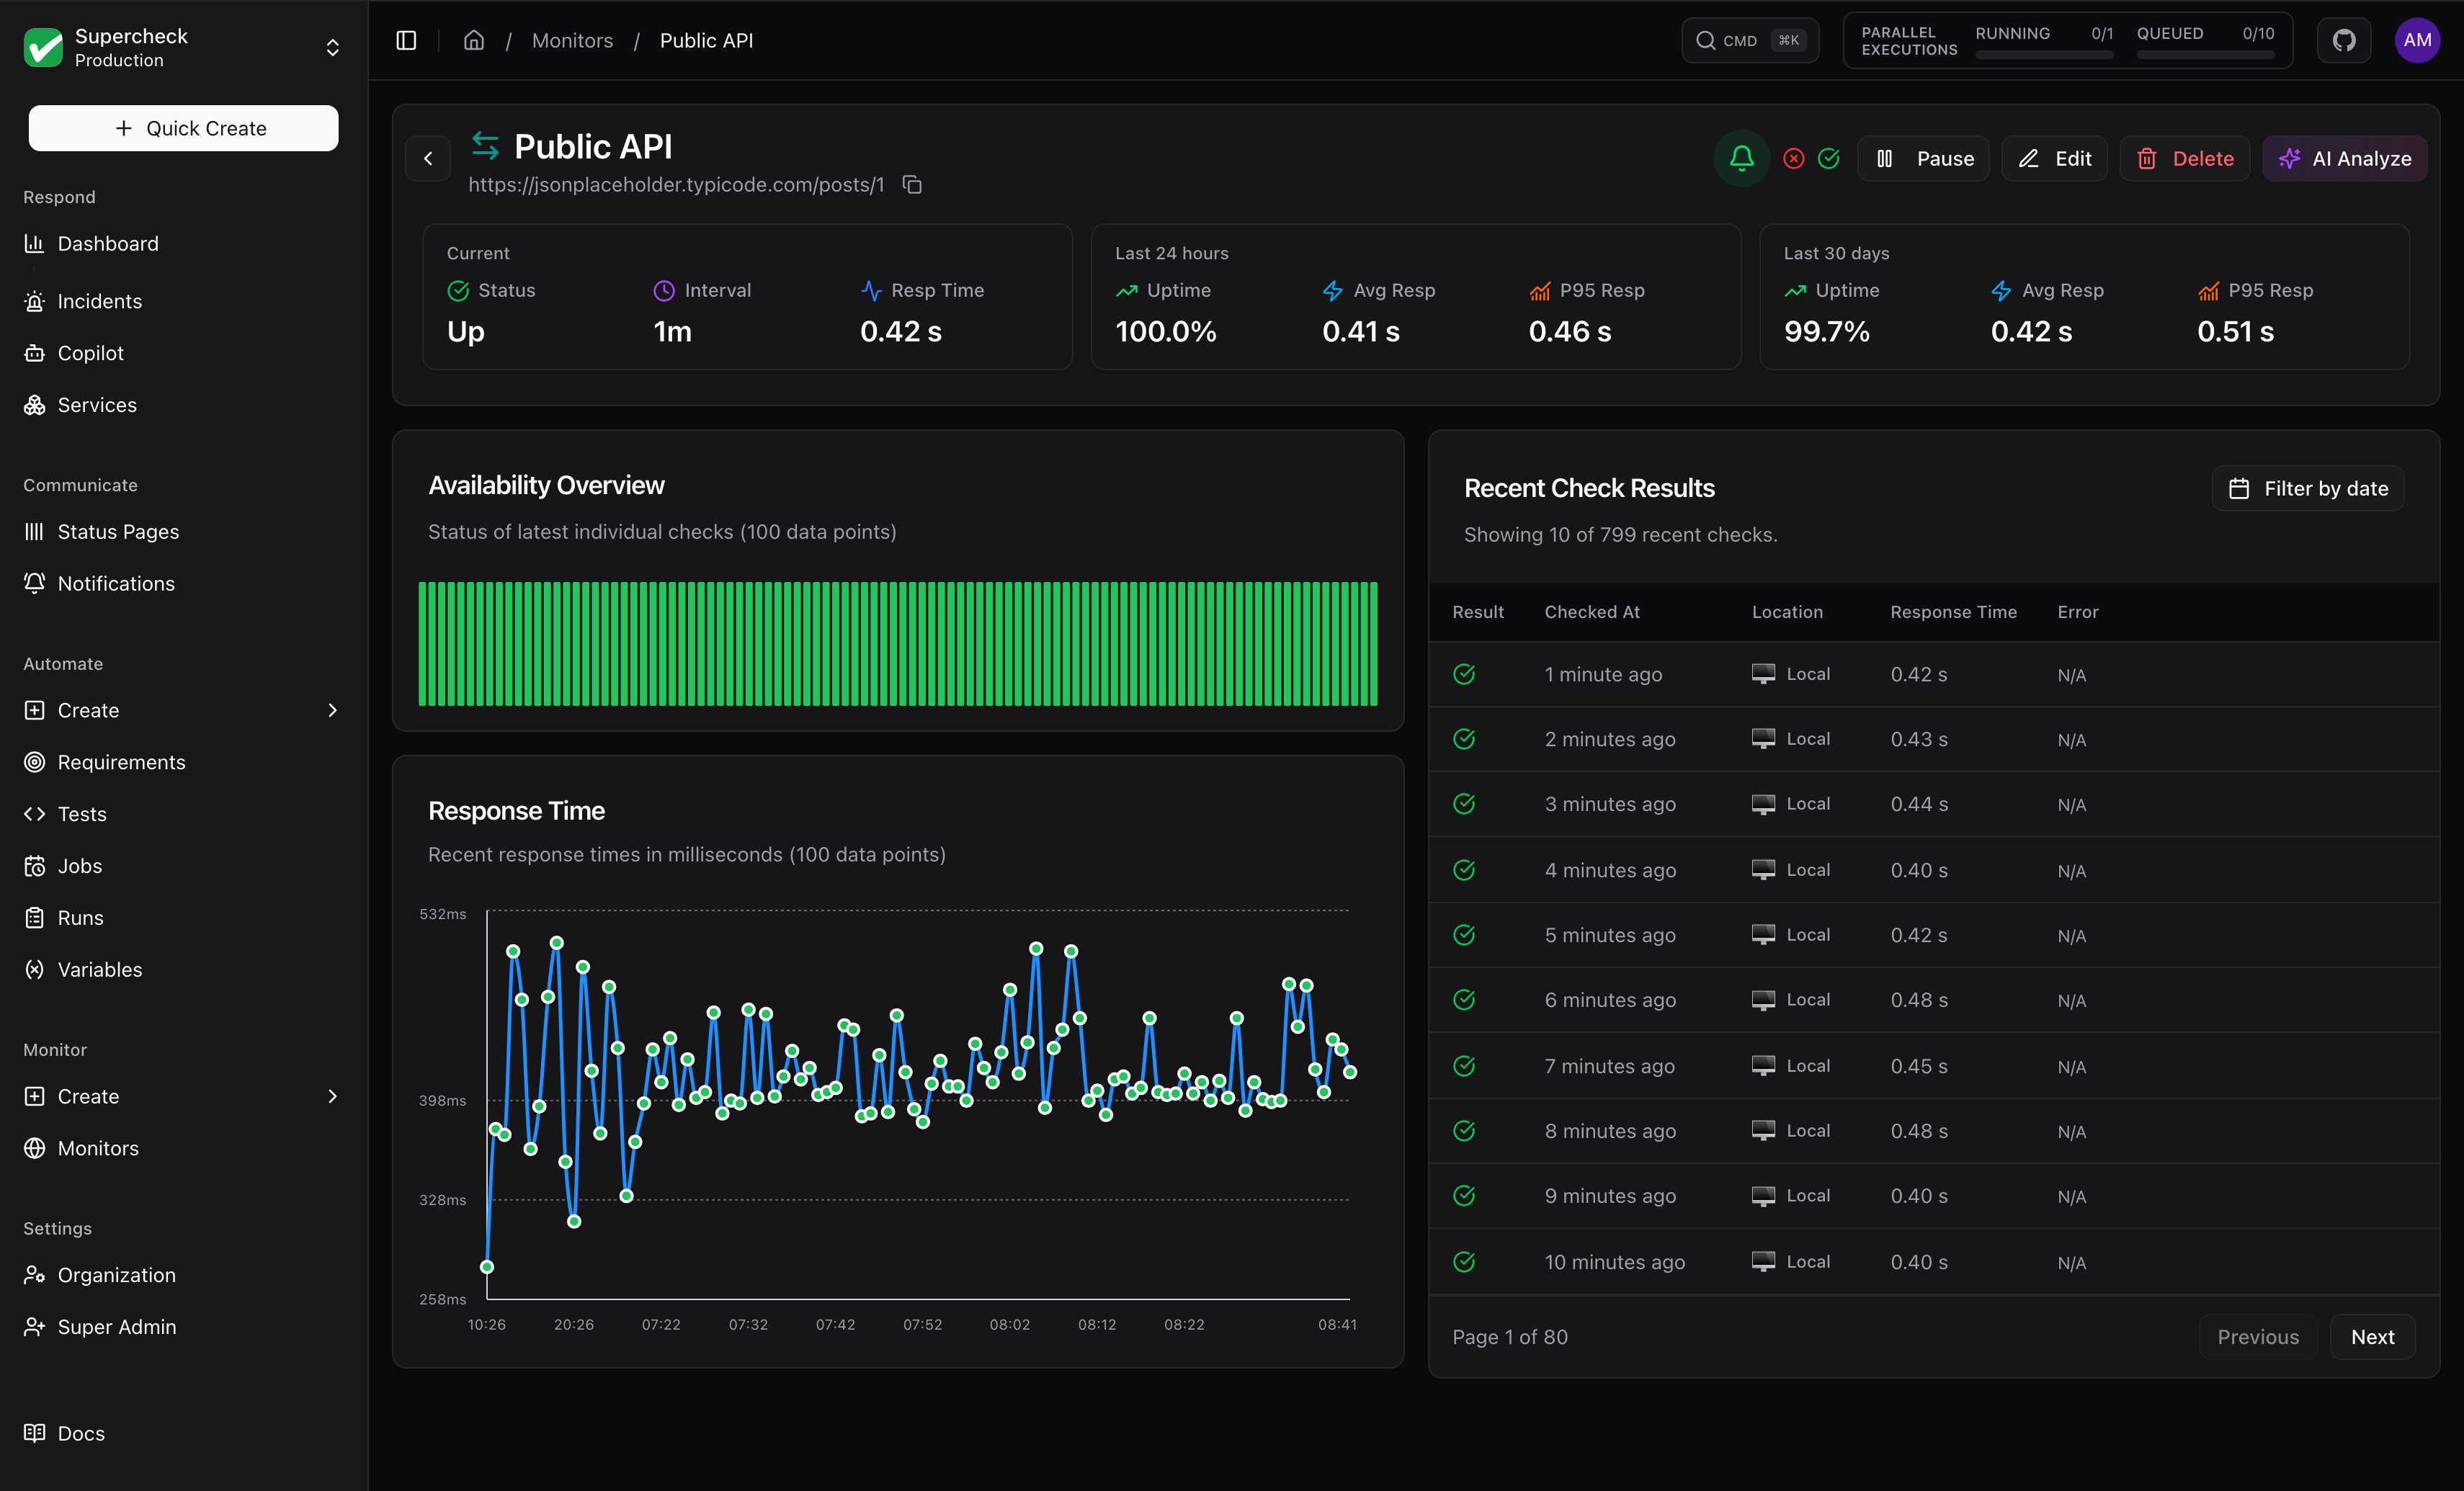
Health, performance and history for one monitor.
Header Section
| Element | Details |
|---|---|
| Monitor Name | The name you assigned to the monitor |
| Test ID | For synthetic monitors, the linked Playwright test ID (click to copy) |
| Action Buttons | Quick access to Pause, Edit, Delete, and AI Analyze |
AI Analyze
AI Analyze in the header generates a report from your monitor's own data.
You need permission to edit the monitor; viewers cannot run it, because it spends AI credits.
| Section | Content |
|---|---|
| Report Details | Monitor name, type, target, current status and analysis time |
| Executive Summary | Short overview of monitor health |
| Performance Analysis | Response time trends |
| Availability Analysis | Uptime and check results |
| Anomaly Detection | Unusual patterns in the data |
| Recent Issues | Errors with timestamps |
| Recommendations | Next steps, only when problems exist |
Self-hosted: an administrator must configure an AI provider first.
Monitor Reports
For Synthetic Monitors, detailed reports are generated when checks fail. Access reports by clicking the report icon in the Error column of the Recent Check Results table.
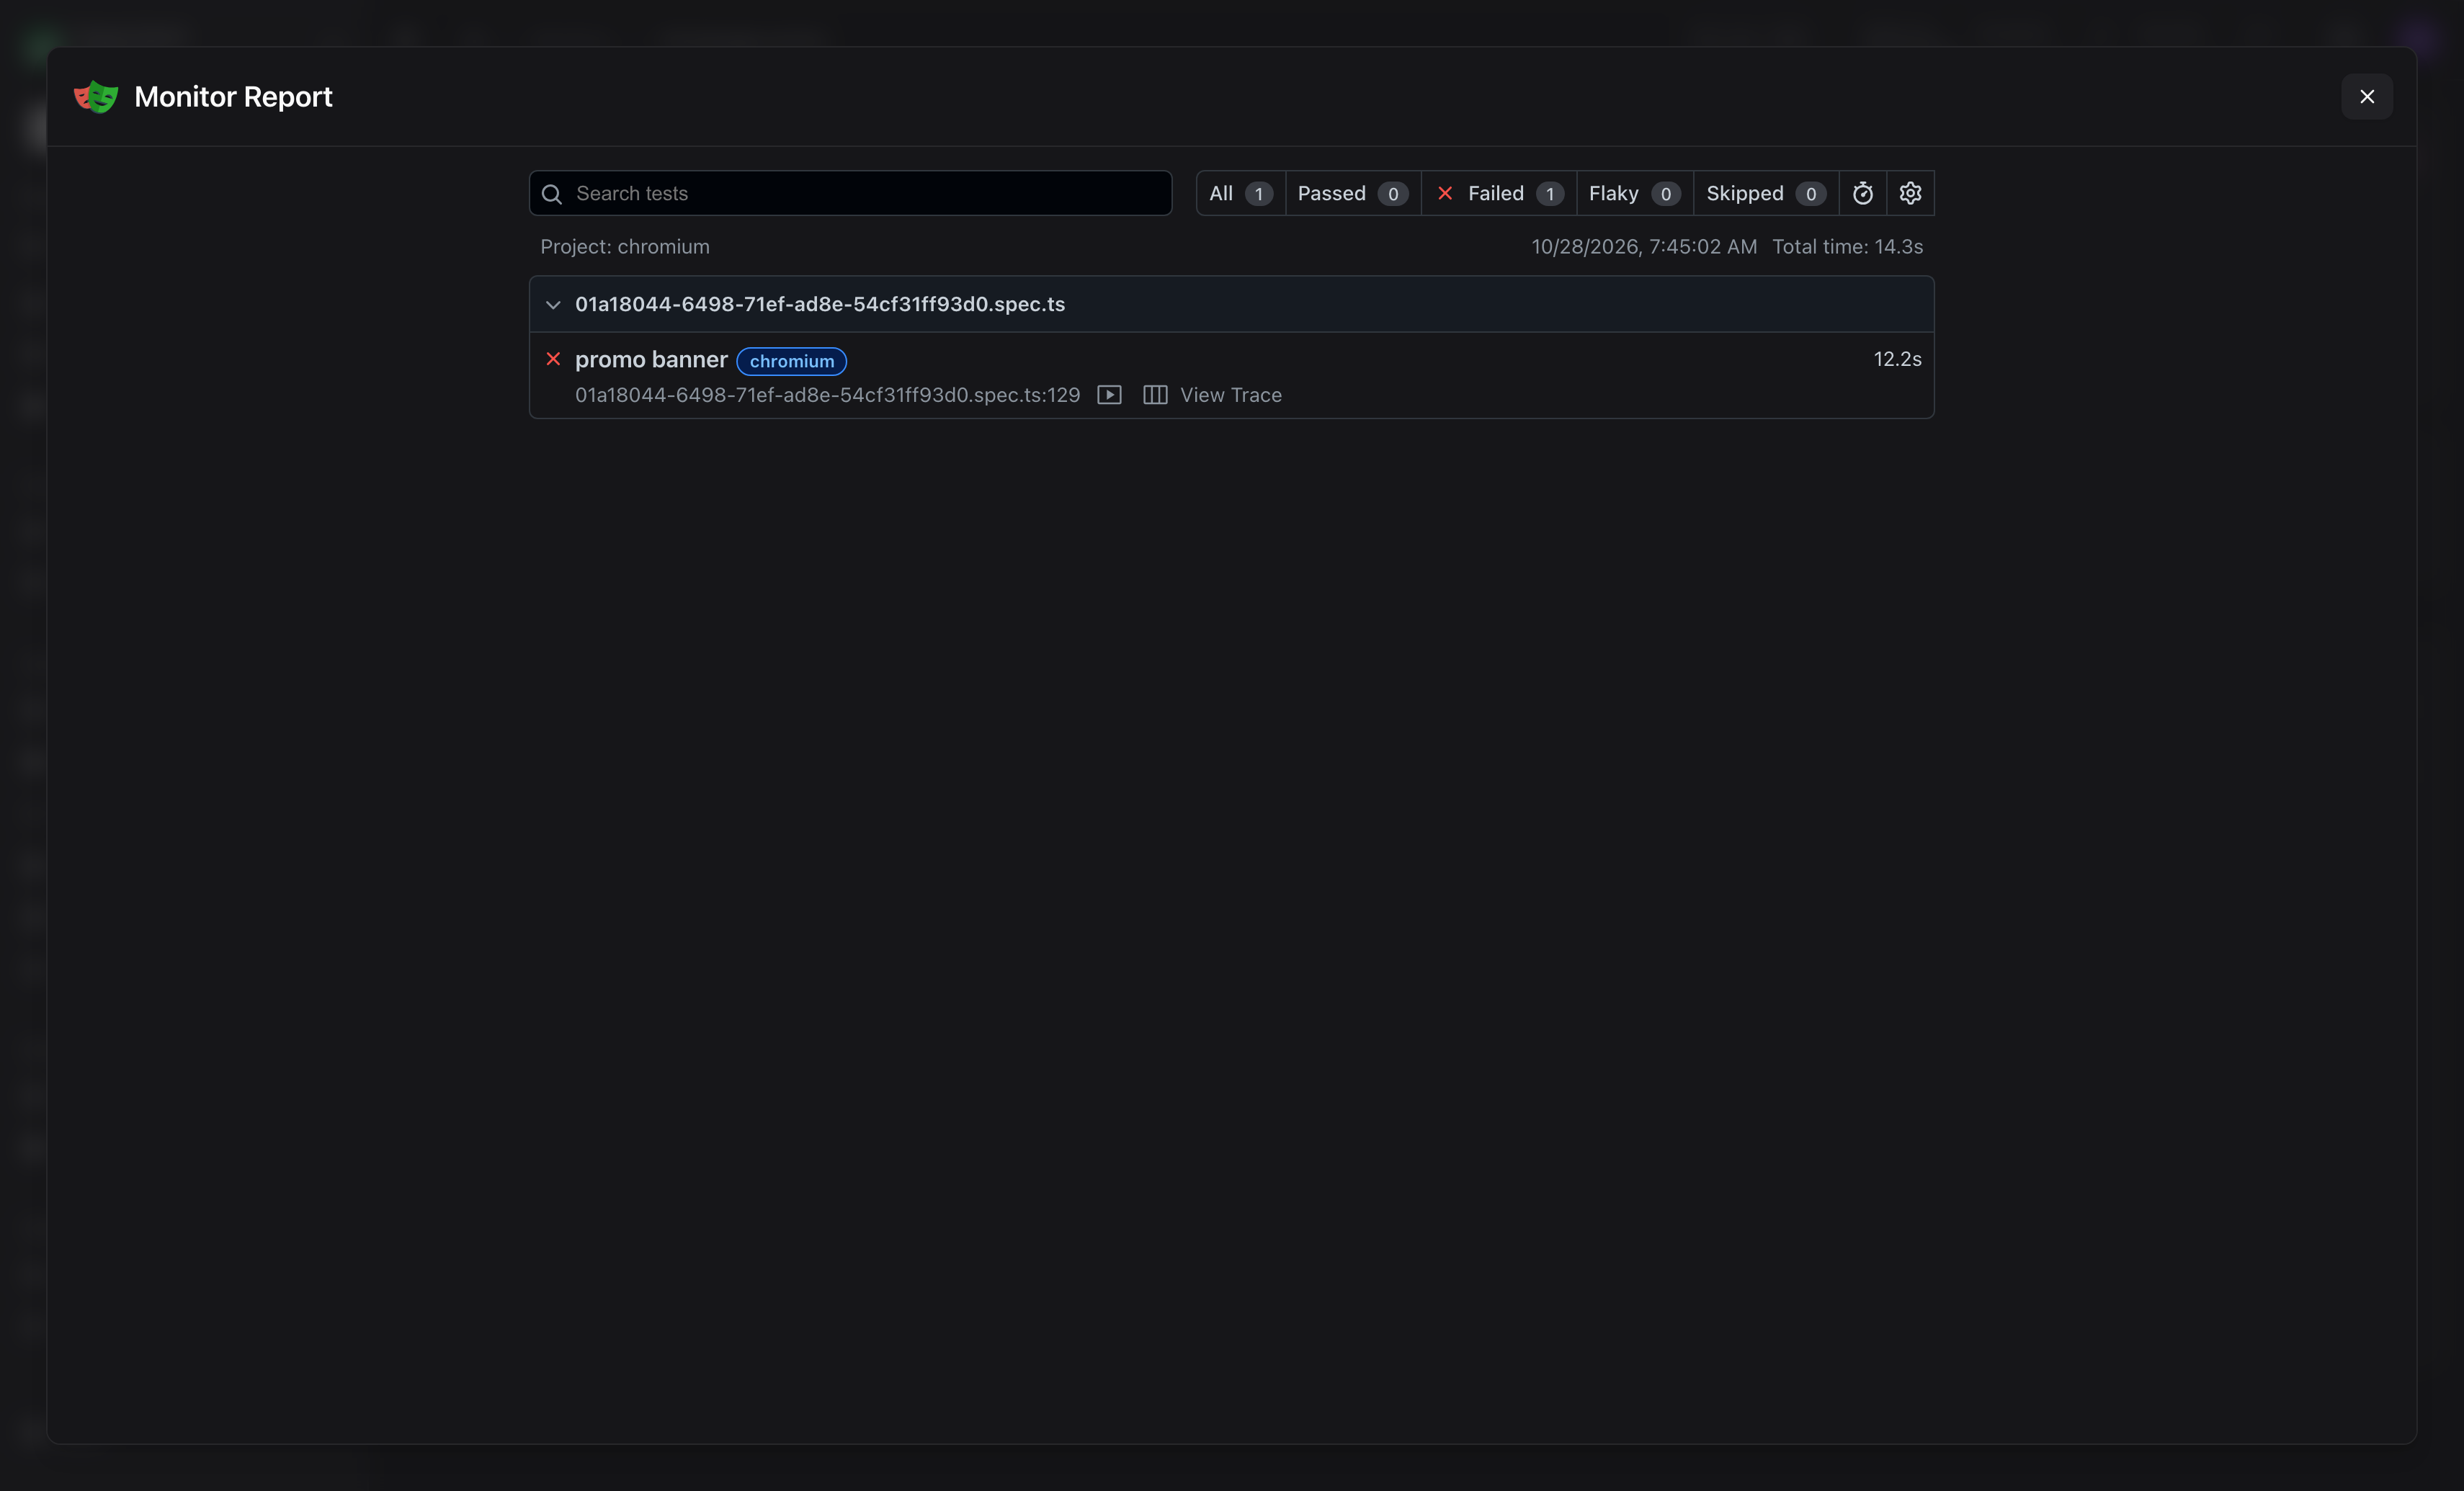
Report Contents
| Section | Description |
|---|---|
| Test Summary | Test name, file path, browser used, and execution duration |
| Error Details | Assertion failures with expected vs received values and stack trace |
| Test Steps | Timeline of all actions with pass/fail status and timing |
| View Trace | Opens trace viewer with video recording, screenshots, and network logs |
Use Copy Prompt to copy error details for AI-assisted debugging.
Monitor Status
| Status | Meaning | Action |
|---|---|---|
| Up | All checks passing | No action needed |
| Down | Latest aggregated check failed | Review results; notifications follow your alert thresholds |
| Paused | Monitoring disabled | Re-enable when ready |
| Pending | Initial check in progress | Wait for first result |
| Maintenance | Reserved status; monitors keep checking during a scheduled maintenance window, and only alerts are held back (see Status Pages) | None |
| Error | Configuration or system error | Fix monitor configuration |
If a monitor's locations have no live worker, that check is skipped and not counted as down. With several locations, only the locations that ran are judged. A scheduled check that waited in a busy queue for more than three times the interval (at least 3 minutes) may be skipped when a newer result already exists; skipped checks record no result, downtime or alert.
When your organization reaches its overage cap with hard stop on, synthetic monitor checks pause until the cap is raised or the billing period resets. They record no result, downtime or alert, and org admins see a banner in the app. HTTP, website, ping and port monitors keep running. See Subscription.
Check Intervals
Available intervals: 1 minute, 5 minutes, 10 minutes, 15 minutes, 30 minutes, 1 hour, 3 hours, 12 hours, and 24 hours. Shorter intervals detect failures sooner and use more resources.
The timeout is set through the API or CLI (the form keeps the stored value). It must not exceed the interval, for example 60 s at 1 minute; the form rejects an interval shorter than the stored timeout.
Synthetic monitors start at 5 minutes. Set the interval longer than your test's run time so executions do not overlap: for a 2-minute test, use 5 minutes or more.