
Incident Investigation
Resolve alerts faster with AI-powered incident workspacesEdit
Incidents are the responder queue for issues that need investigation, evidence review, or recovery confirmation.
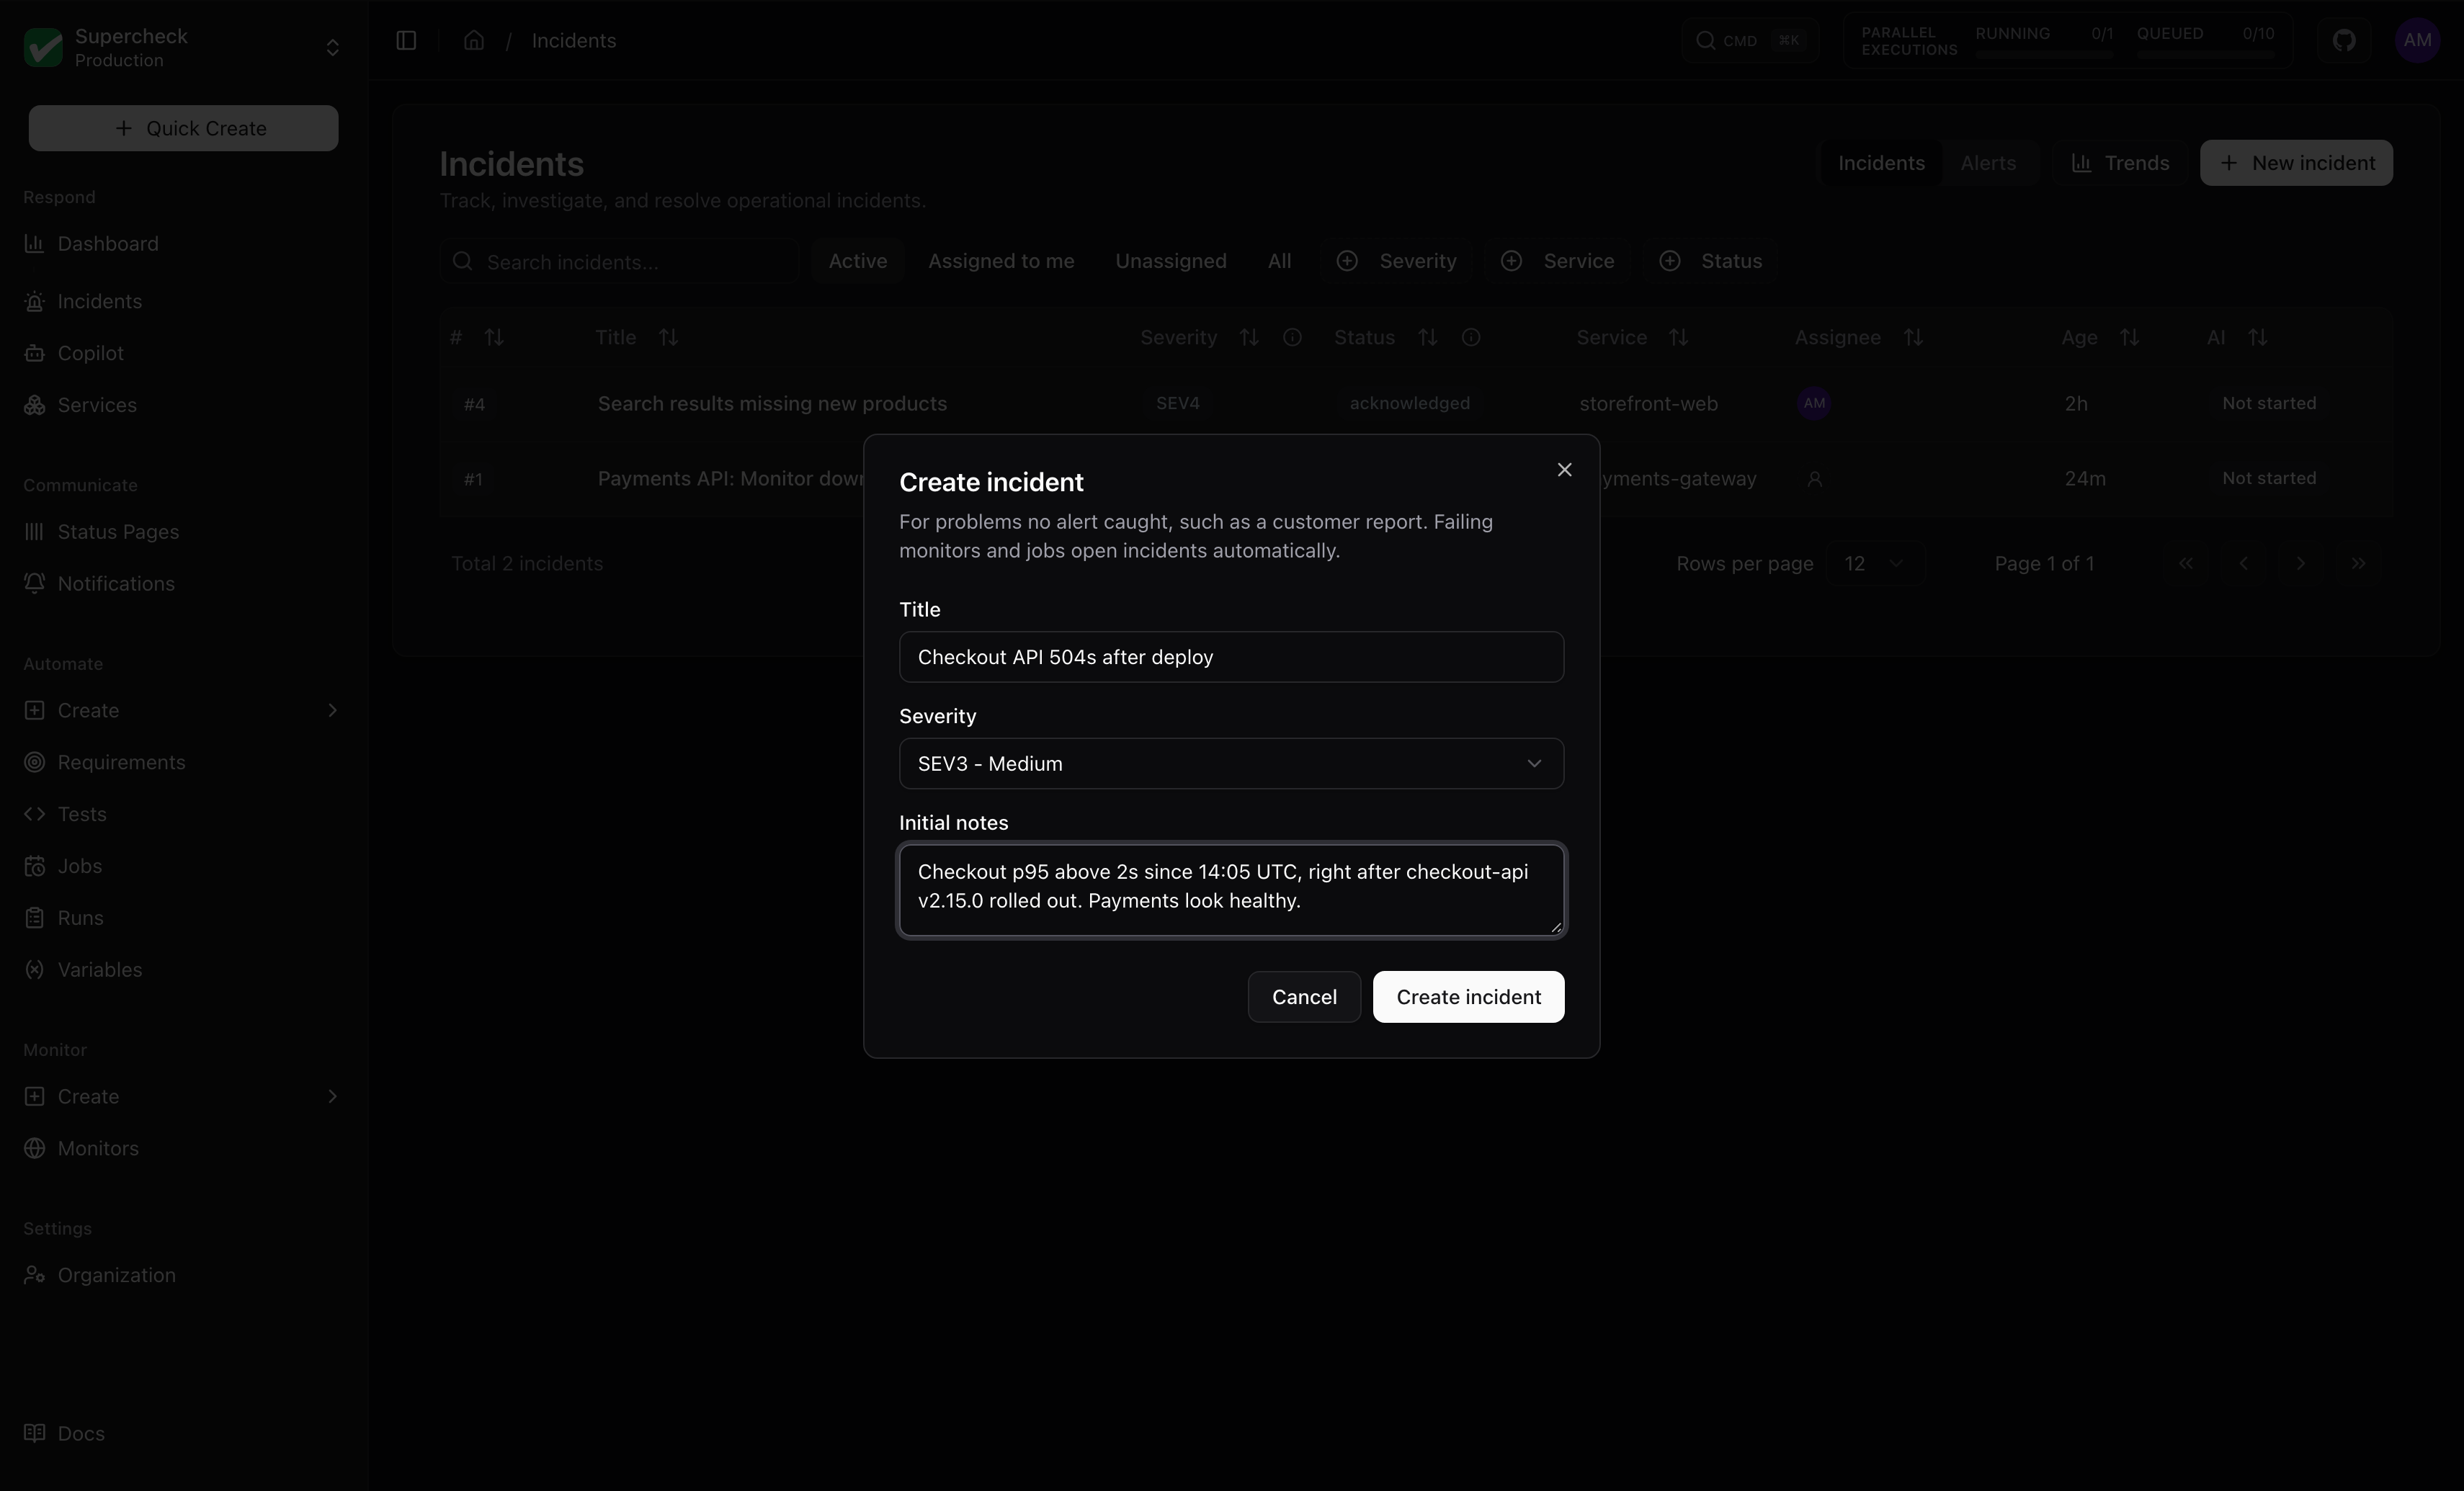
Create an Incident
| From | How |
|---|---|
| An alert | Incidents open automatically when a monitor or job alert fires, with no setup beyond enabling alerts. Repeated alerts for the same target join the same incident. You can also select Open incident next to a failure in Communicate → Notifications → Delivery history. Neither path starts a full AI investigation unless the project turned on Investigate new incidents automatically (see Default policy) |
| Scratch | In Respond → Incidents, select New incident for issues that did not come from a Supercheck alert. You become the assignee |
Both paths open the incident workspace. If AI triage fails, the Activity feed records a triage failed event with the error code, so the failure is visible on the incident.
Incident Queue
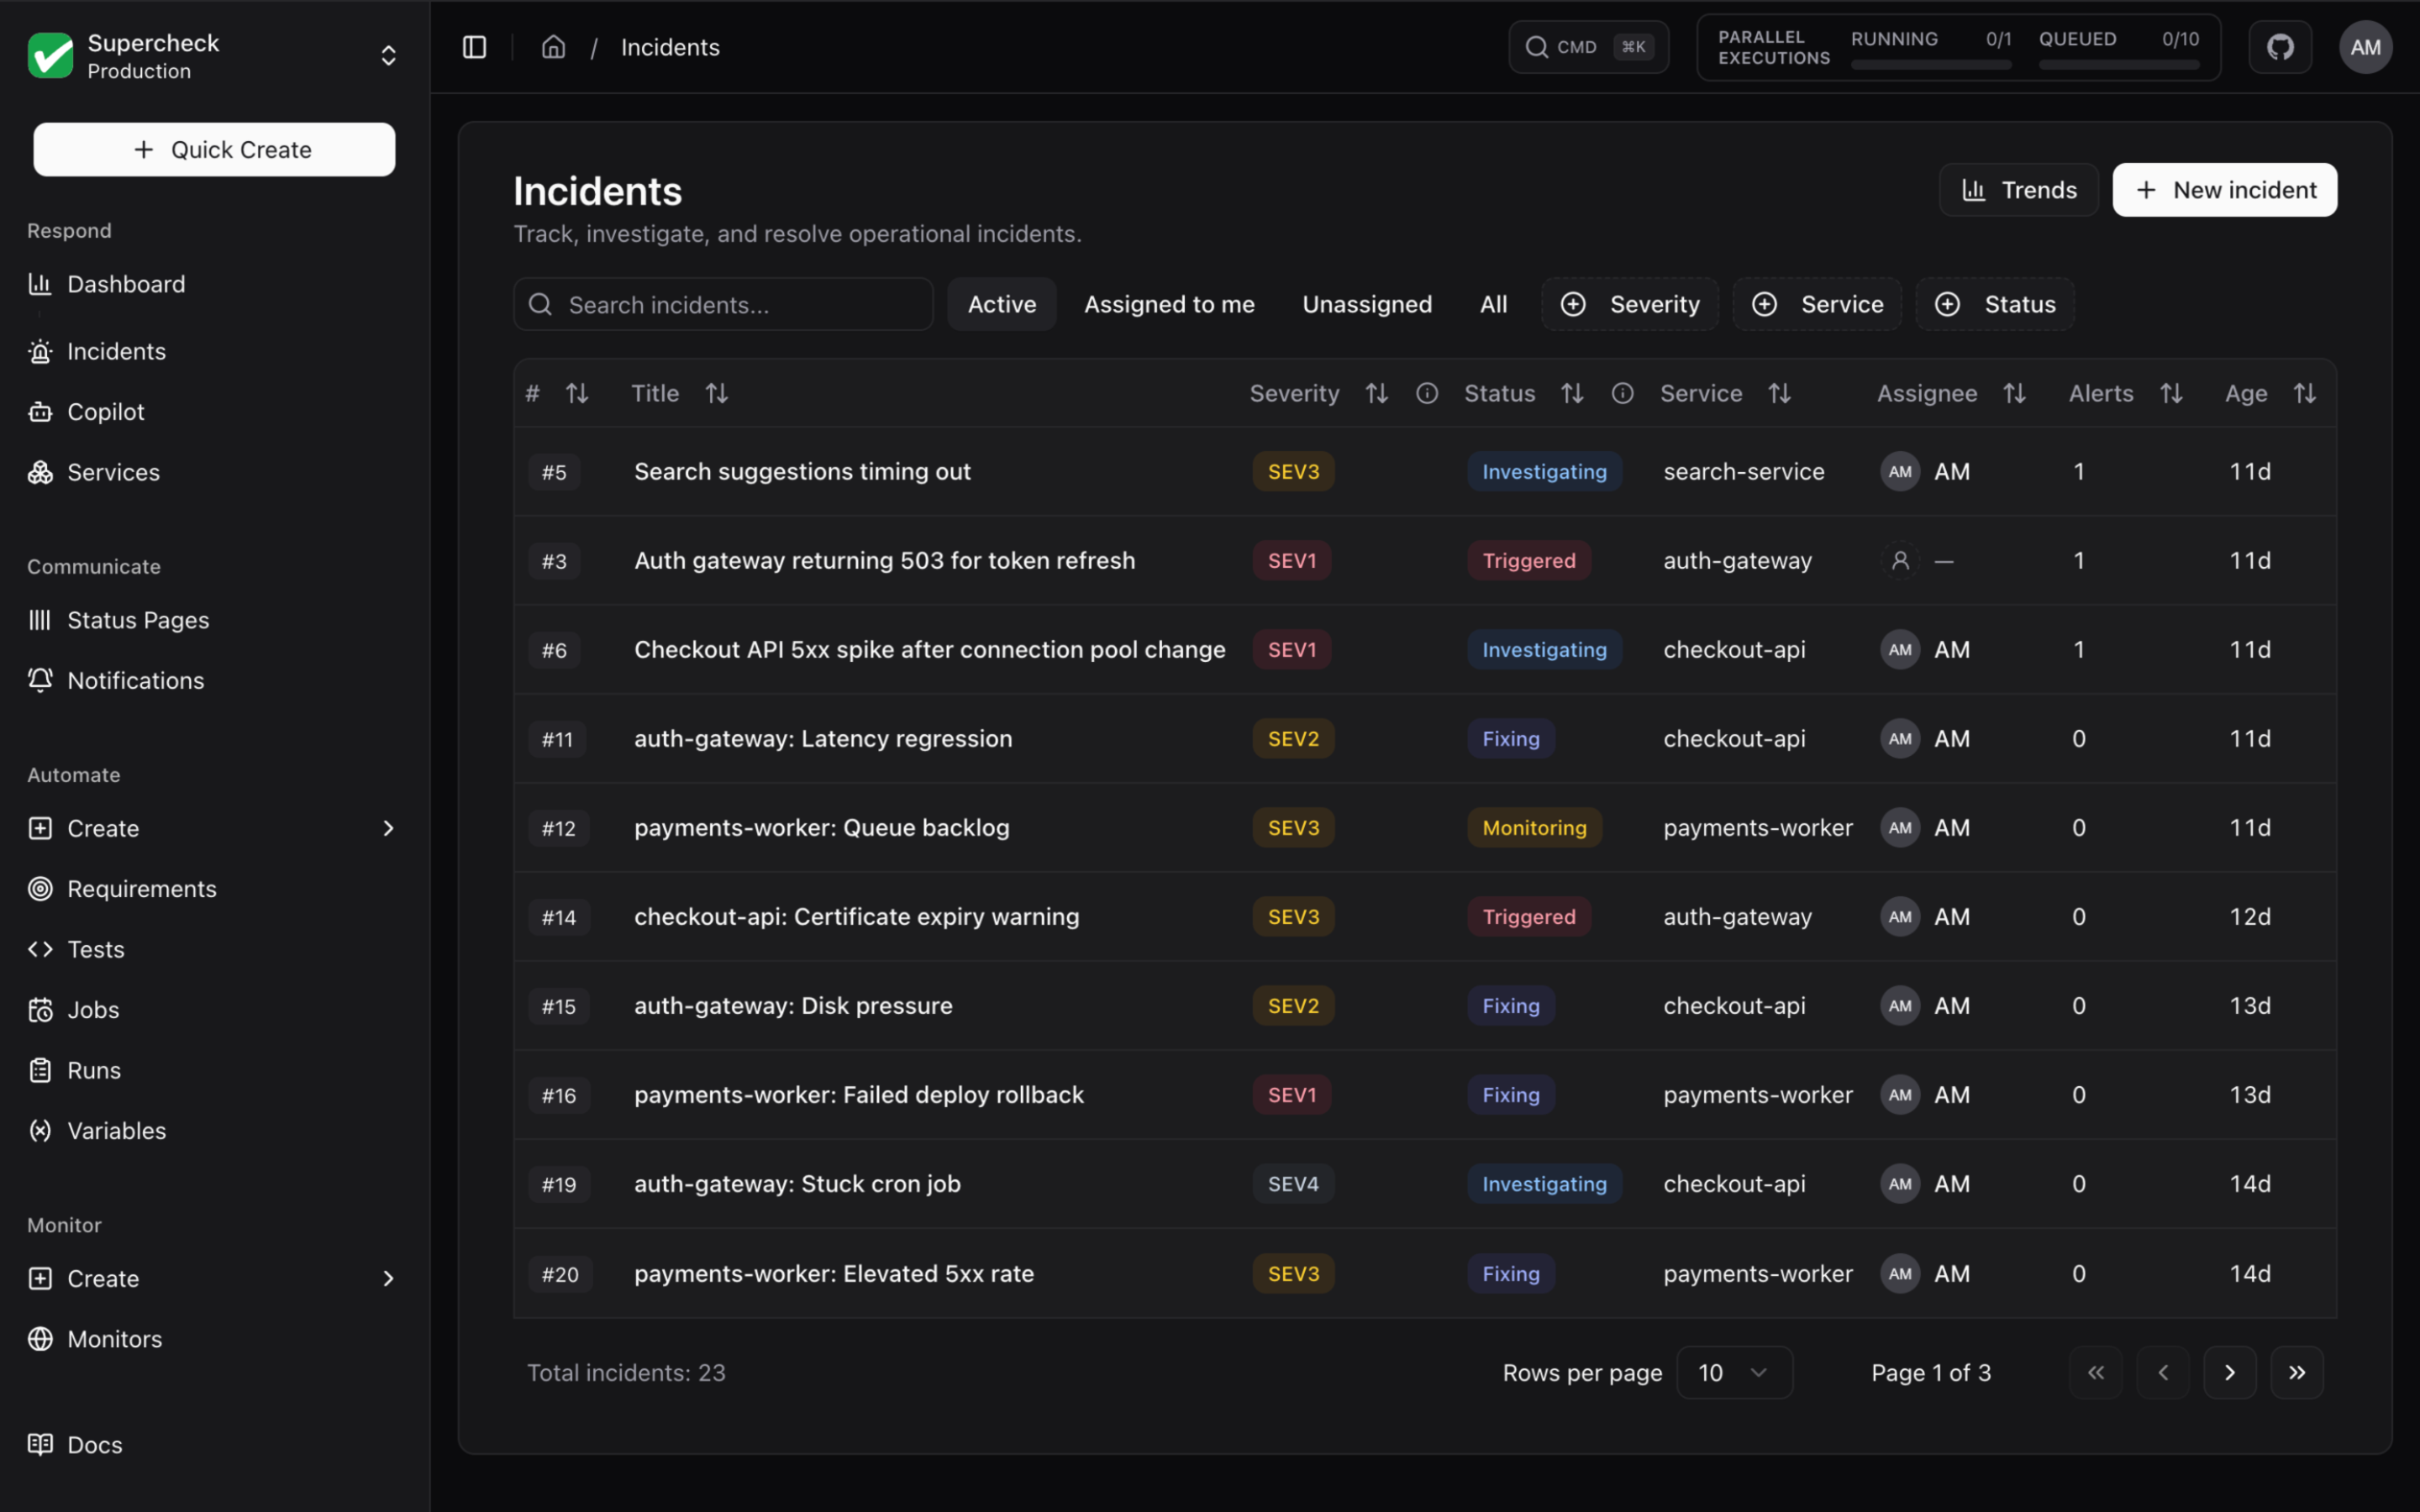
Open Incidents in the sidebar. Trends and New incident are in the page header. Alert notifications sent are listed under Notifications → Delivery history (see Alerts).
The queue opens on Active incidents. Use the quick filters Active, Assigned to me, Unassigned, and All, or narrow by severity (SEV1 through SEV4), status, service, or title.
| Column | Shows |
|---|---|
| # | Incident number |
| Title, Severity, Status | What happened and how urgent it is |
| Service | The linked catalog service |
| Assignee | The person responsible, or Unassigned |
| Age | Time since detection (detection to resolution once resolved) |
| AI | State of the latest AI investigation |
| Updated | When the incident last changed. The queue sorts by it, newest first |
Statuses
The queue and incident page show six statuses. Each maps from the stored incident status.
| Status | Meaning | Stored status |
|---|---|---|
| Triggered | An alert opened the incident and nobody has acknowledged it | triggered, not acknowledged |
| Acknowledged | Someone is on it | triggered, acknowledged |
| Investigating | The team or the AI is looking for the cause | investigating |
| Fixing | The cause is known and a fix is being prepared or applied | identified, recommendations_ready, user_applying_fix |
| Monitoring | A fix is in place and you are watching it hold | verifying |
| Resolved | The incident is over | resolved |
The API, CLI, and MCP return the label as statusLabel next to the stored status. Status filters take the stored values.
Titles
Incidents opened by an alert are titled <target>: <alert type>, for example Checkout API: Monitor down or Nightly job: Job failed.
Incident Workspace
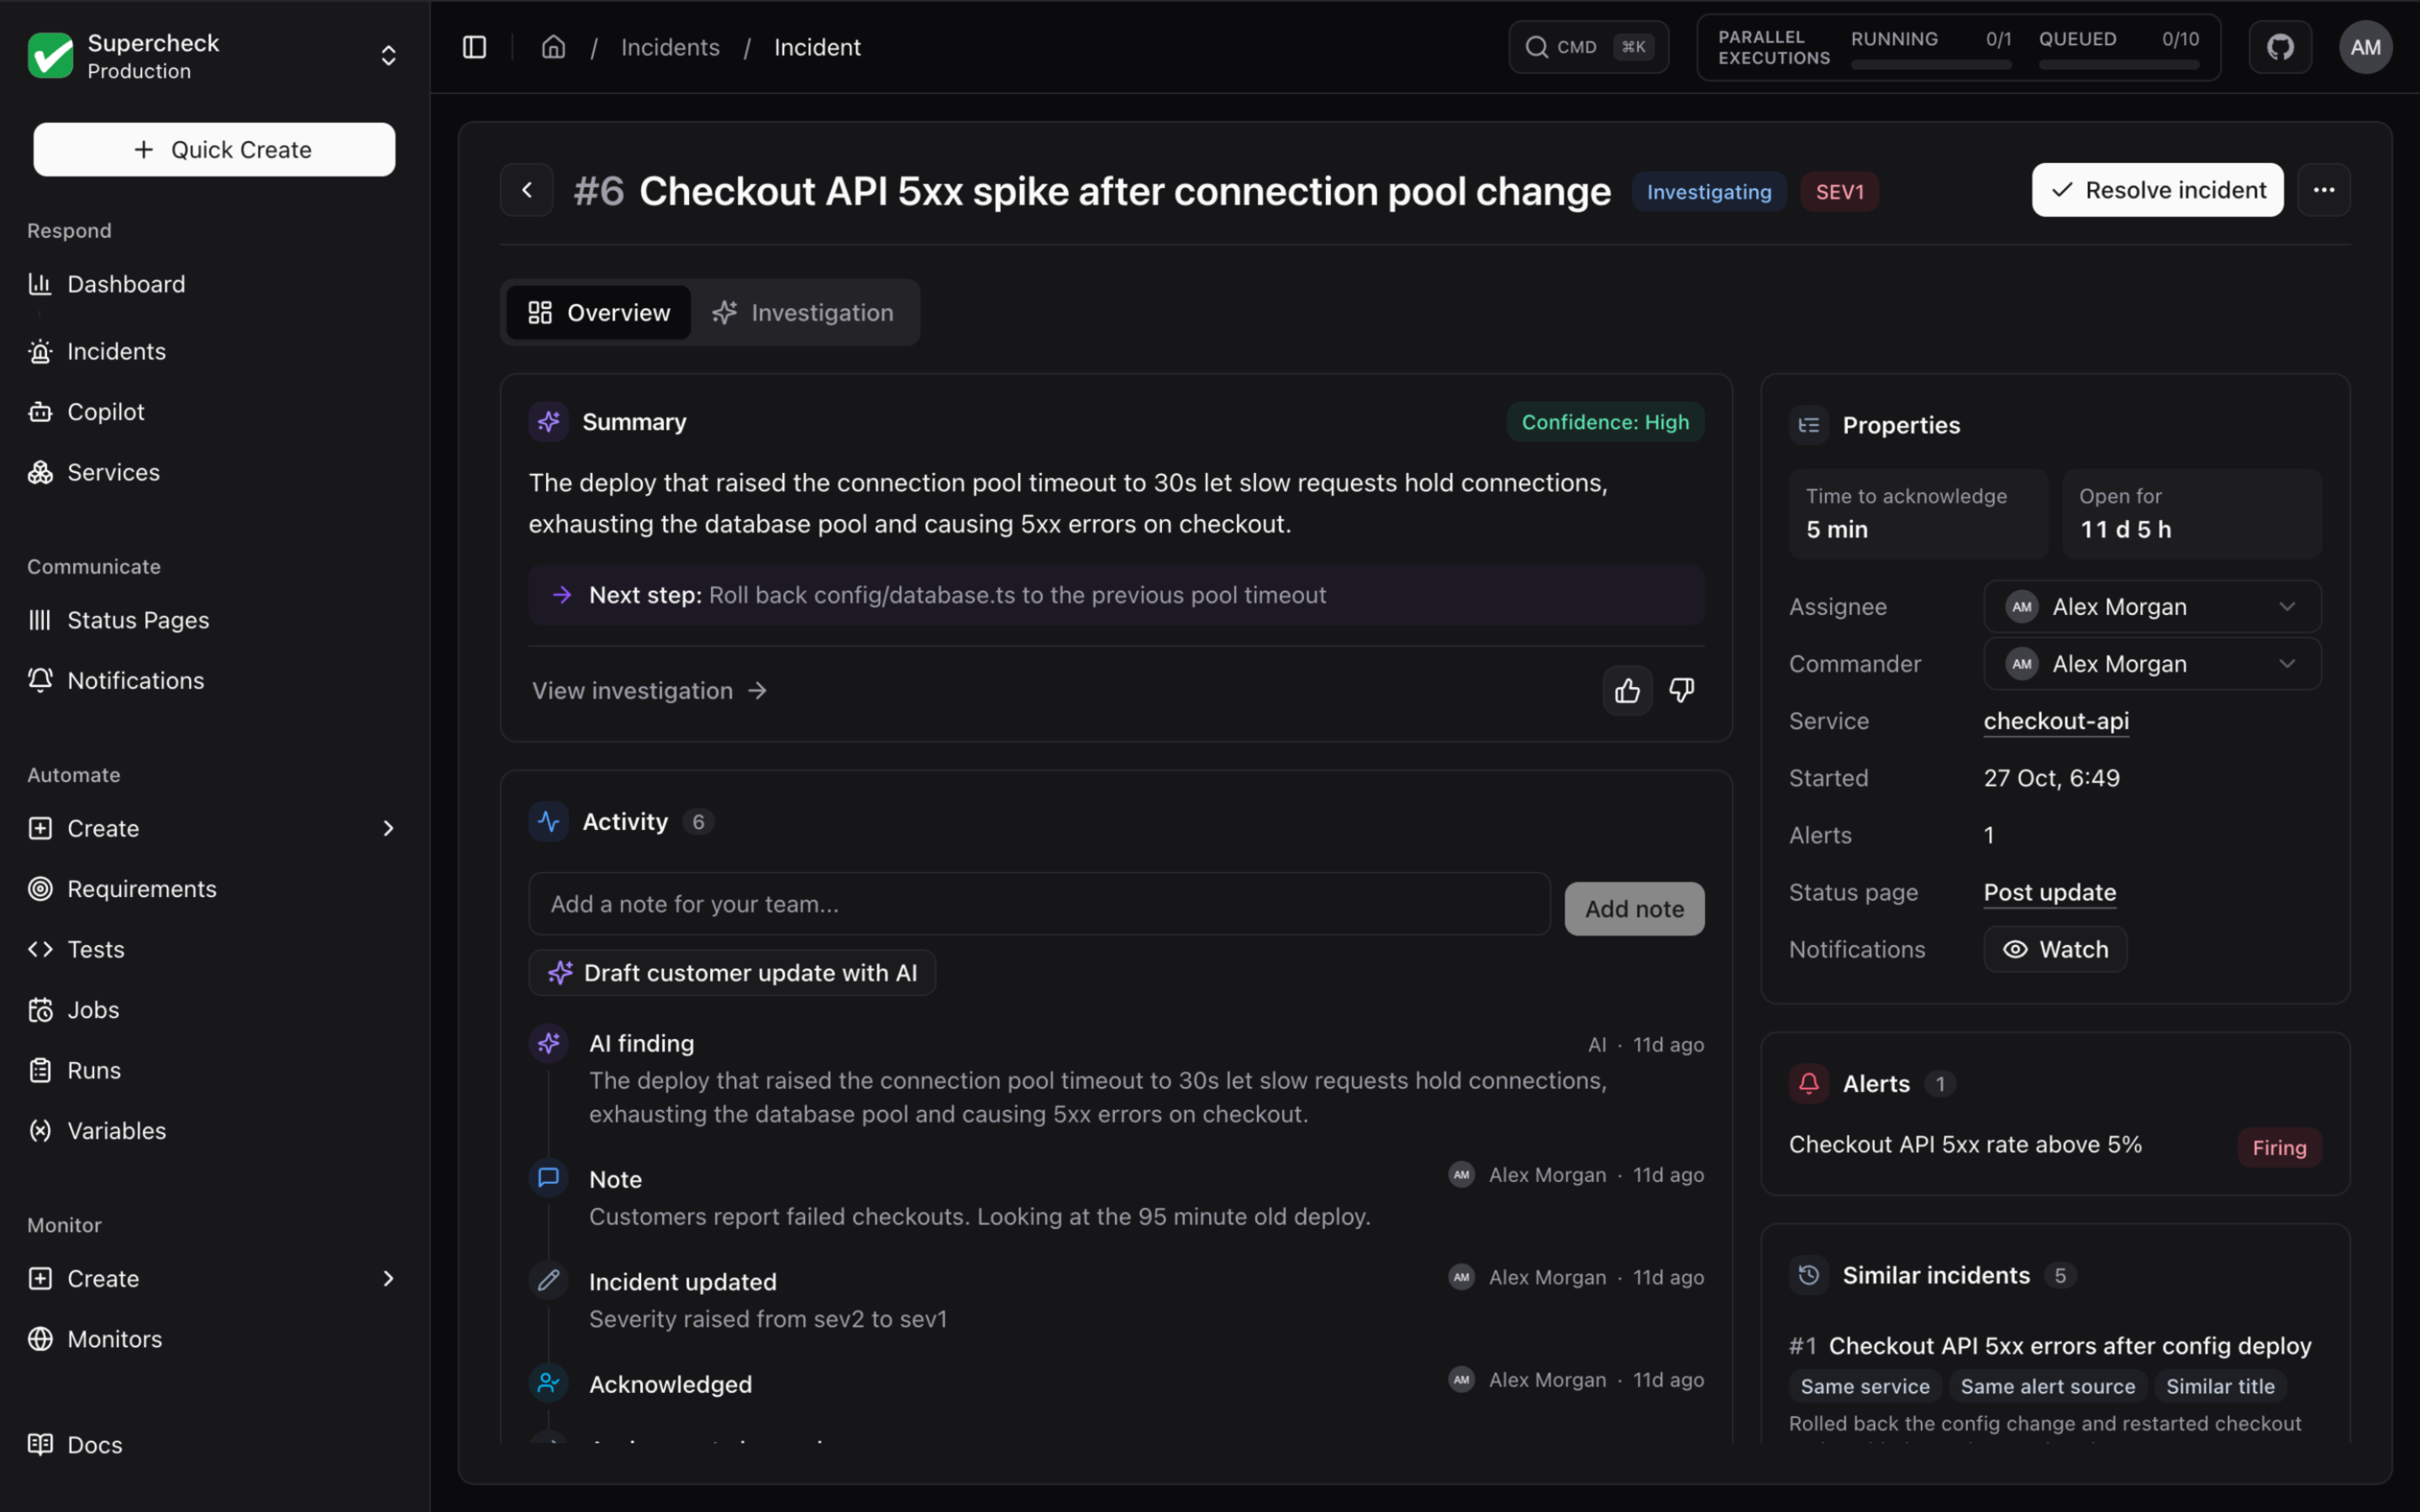
The header shows the incident number, title, status (Triggered, Acknowledged, Investigating, Fixing, Monitoring or Resolved) and severity. One primary button follows the incident: Acknowledge, then Resolve incident. The ... menu holds Edit incident, Add commander, Resolve incident (before acknowledging), and Ask Copilot, which opens Copilot with this incident in scope.
Below the header, the page has tabs. The right-hand column stays the same on every tab: Properties, Alerts, and Similar incidents when there are matches.
| Tab | Contents |
|---|---|
| Overview | Summary: one paragraph from the AI, with confidence and the first next step for an investigation, Right / Wrong buttons, and View investigation. Before any AI analysis it shows Run investigation. Activity: a box to post updates above the event list. Draft customer update with AI fills the box with a customer-safe draft for you to edit. Also post to status page publishes the note as an update on the incident's linked status page incident and emails its subscribers (needs permission to update status pages). The feed shows old → new values for edits, severity and status changes, reassignments, the alert that was linked, and one line for each AI triage, AI investigation and Evidence brief |
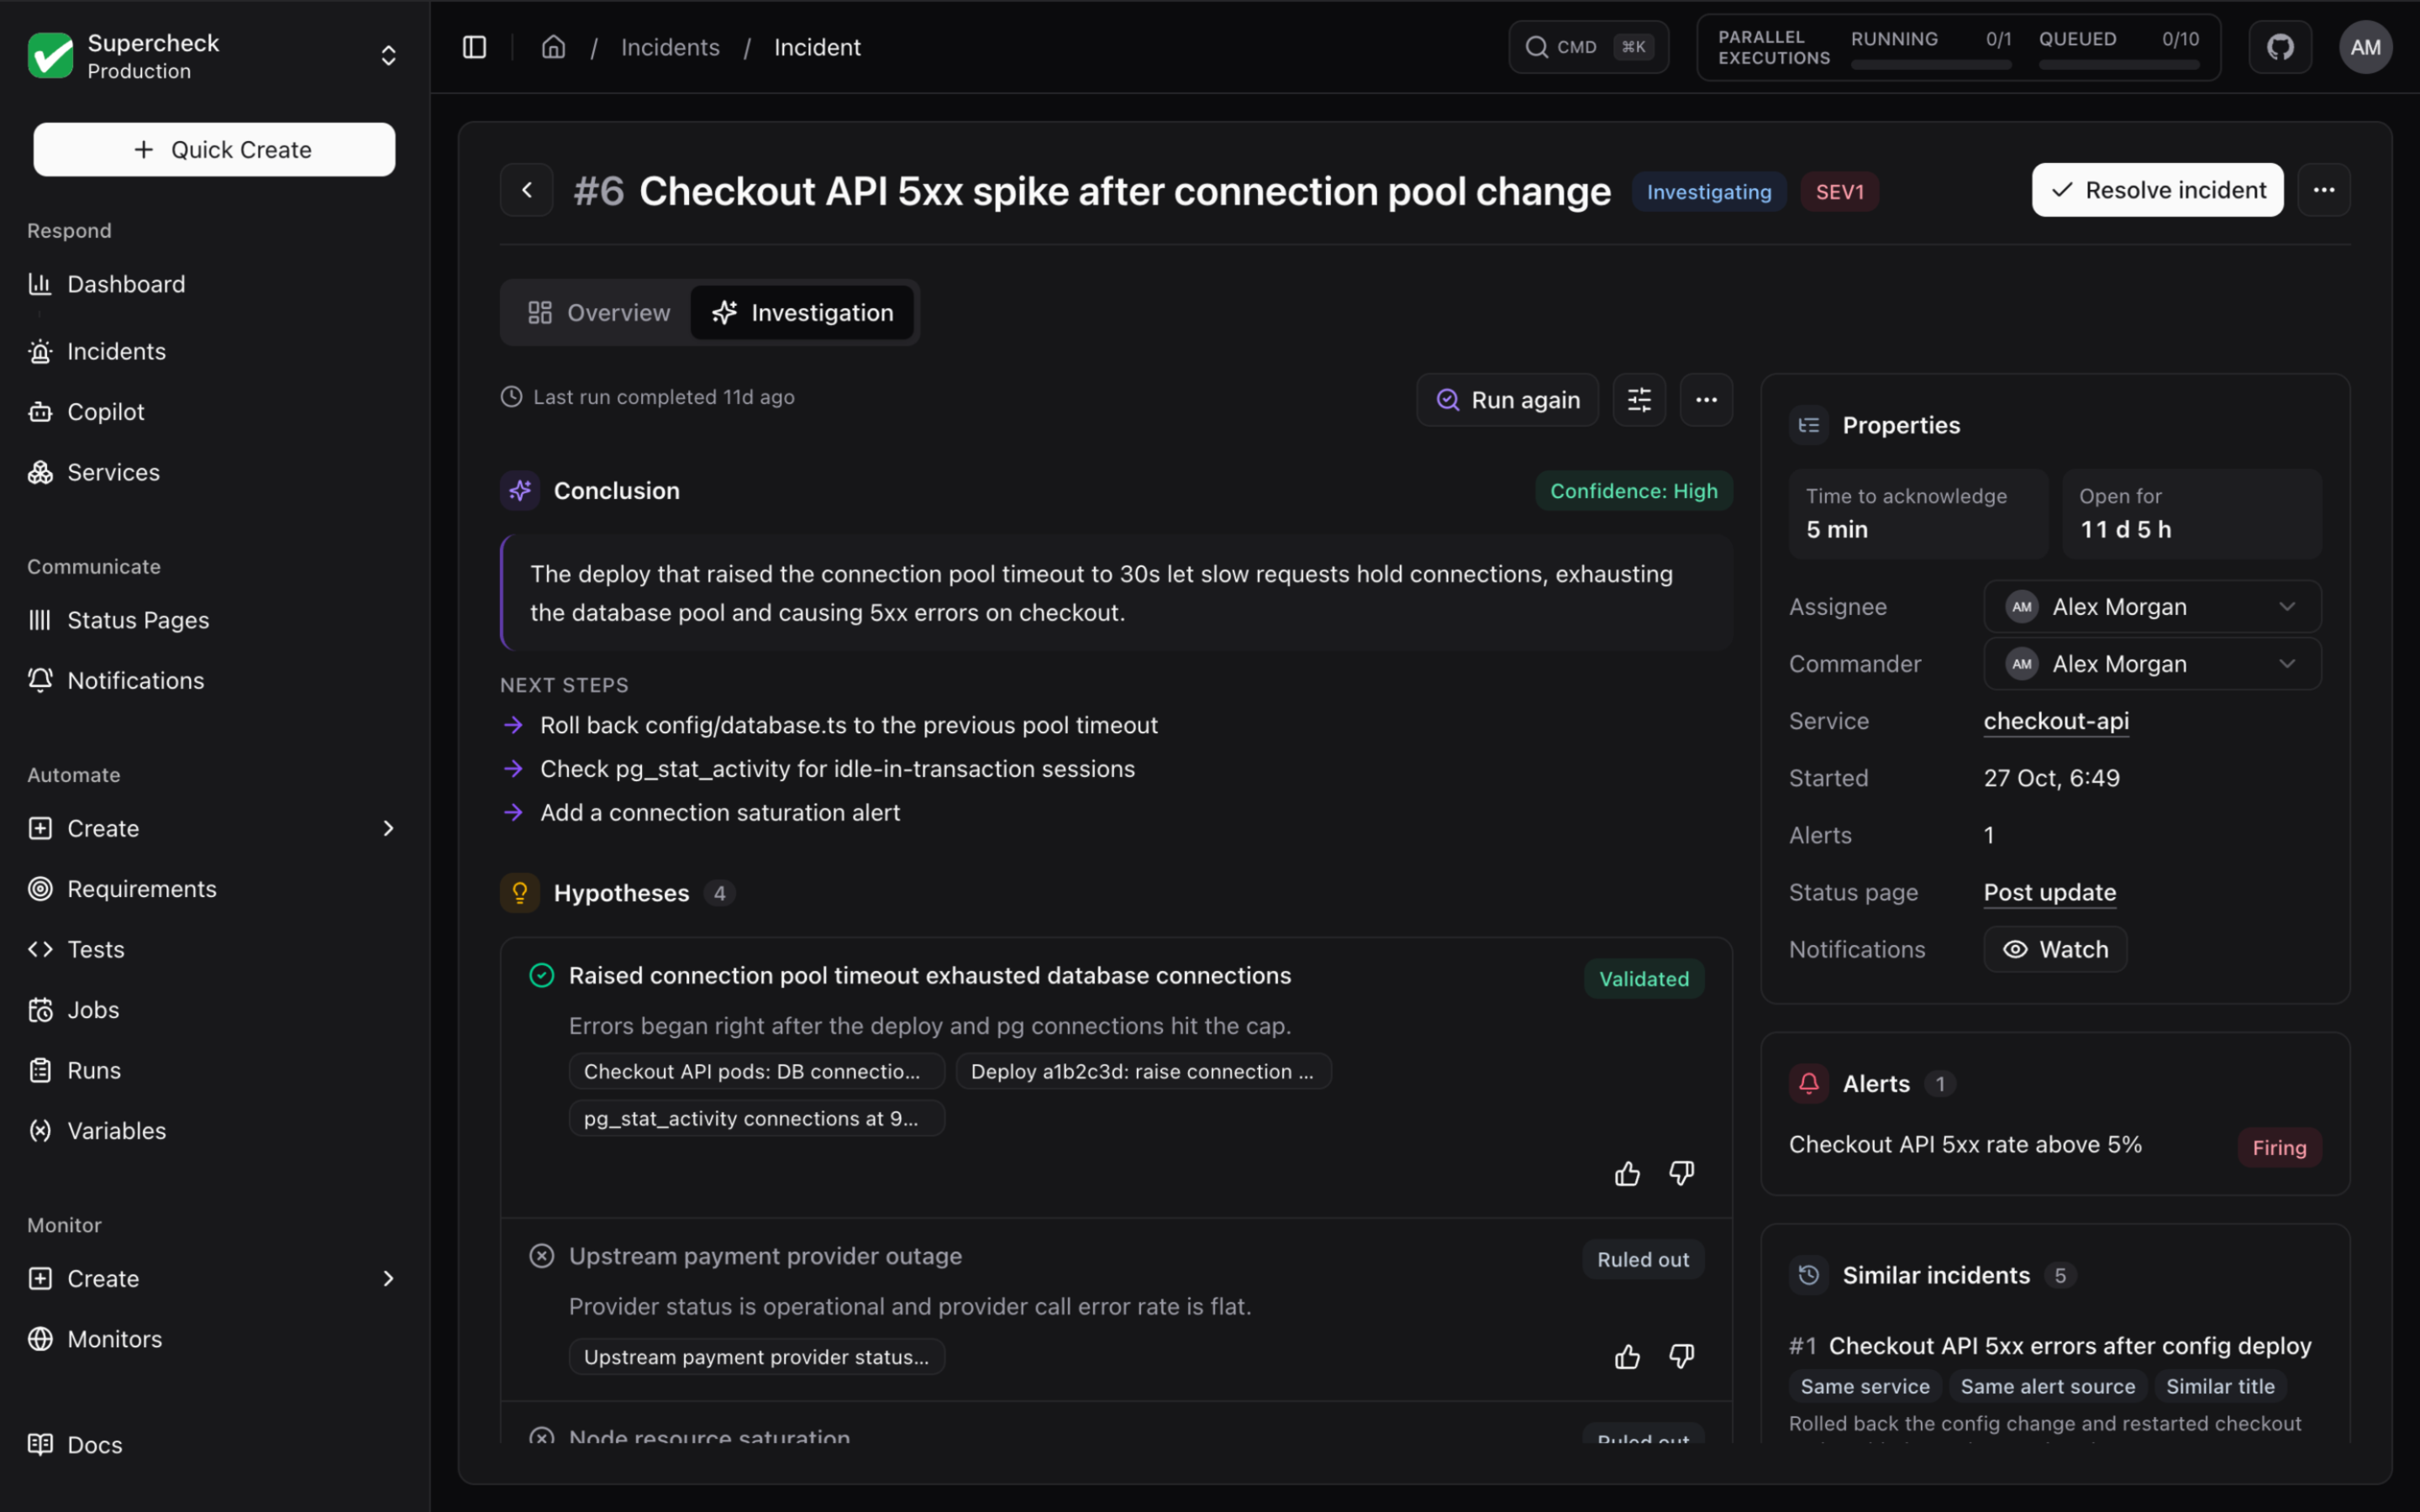
| Investigation | One report: run controls, Conclusion with the first three next steps (Show all for the rest), Hypotheses (each with a green, amber or grey icon and badge for validated, inconclusive or ruled out), Evidence with an icon for each type, and a collapsed How it was investigated step log |
| Post-mortem | Shown once the incident is resolved. See Post-mortem |
The Properties card shows Time to acknowledge and Time to resolve (or Open for while the incident is open), then the assignee (and an optional commander), service, start time, Status page state with Post update, and a Notifications row with a Watch / Unwatch button. The Alerts card lists the linked alerts. Each Activity row has an icon for its kind of event and shows how long ago it happened; hover the time for the exact date.
The open tab is kept in the URL: ?tab=investigation or ?tab=postmortem (Overview has no parameter). The older links still work: ?tab=evidence opens the Investigation tab at the evidence list, ?tab=brief opens it at the conclusion, and a #sre-evidence-<id> link scrolls to that item.
If an incident cannot be opened, the page says whether it was not found, you do not have access, or loading failed. It offers Try again (for a failed load) and a link back to Incidents.
AI summary
The summary card and the Investigation tab answer these questions in order. The card shows a short version; the tab shows the full report.
| Part | What it tells you |
|---|---|
| Conclusion | What changed, the blast radius, the strongest signals, and the likely cause |
| Confidence | High, Medium, Low, or Inconclusive. Only an investigation is rated; an evidence brief or a triage summary is labelled as such and has no rating |
| Recommended next steps | Safe checks to run next. The card shows the first one |
| Hypotheses | Ranked explanations, each marked Validated, Ruled out, or Inconclusive, with a short rationale and its evidence |
Inconclusive is a normal result, not a failure. When the evidence does not establish a cause, the agent says what is missing and lists safe next checks instead of guessing. A hypothesis is only Validated when it cites real evidence from this incident. Runs whose output could not be validated show a plain summary without hypotheses or a confidence rating.
On the Investigation tab, How it was investigated lists each check the agent ran, a short summary of its arguments (secrets are never shown) and how many results came back. It is collapsed once the run is done and updates live while a run is in progress.
Run, re-run, and give feedback
| Control | What it does |
|---|---|
| Run investigation / Run again | Starts a bounded, read-only AI pass over stored evidence and optional live connectors. Only one run can be active per incident; starting another returns 409 until it finishes |
| Run options | Opens Include live sources (off by default; needs a linked service and connector investigation permission) and Re-run with my note |
| Right / Wrong | On the whole investigation or on any single hypothesis, with an optional one-line note (up to 500 characters). Needs permission to update incidents |
| Re-run with my note | In Run options. Starts a new investigation that also sees your note as guidance, plus the notes you left on earlier runs |
| Save report snapshot | In the Investigation tab's More menu once a run completes. Locks the sanitized report for audit and review |
Your notes are hints, not evidence. Recent notes on other incidents of the same service are also passed to future investigations as hints. If a run fails or times out, review the error and available evidence before retrying.
Similar incidents
The Similar incidents card in the right-hand column (shown only when there are matches) lists up to five resolved incidents from the last 180 days (the top three first, with Show all for the rest) in the same project that share the primary service, the alert source, or words in the title. It shows why each one matched and how it was resolved. A past root cause is context only: the investigation does not copy it without evidence from the current incident.
Evidence
The Evidence section of the Investigation tab lists observations from Supercheck checks and connected systems.
| Item | Contents |
|---|---|
| Evidence items | Observations such as HTTP response codes, latency spikes, test assertions, and traces |
| Evidence brief | A quick AI summary of the saved evidence (Summary, Impact, Likely cause, Evidence gaps, Next checks). It is the Conclusion until an investigation has run (ahead of the AI triage finding), and it can be copied or downloaded as Markdown. Generate brief / Regenerate brief are offered until an investigation completes; after that the investigation is the report, and a brief never replaces its conclusion or confidence |
Stored evidence stays available when a connector is disabled. Disabling a connector stops new live searches but does not remove evidence already collected. Save report snapshot and the Evidence brief can be downloaded to share; credentials and raw connector responses are excluded.
Post-mortem
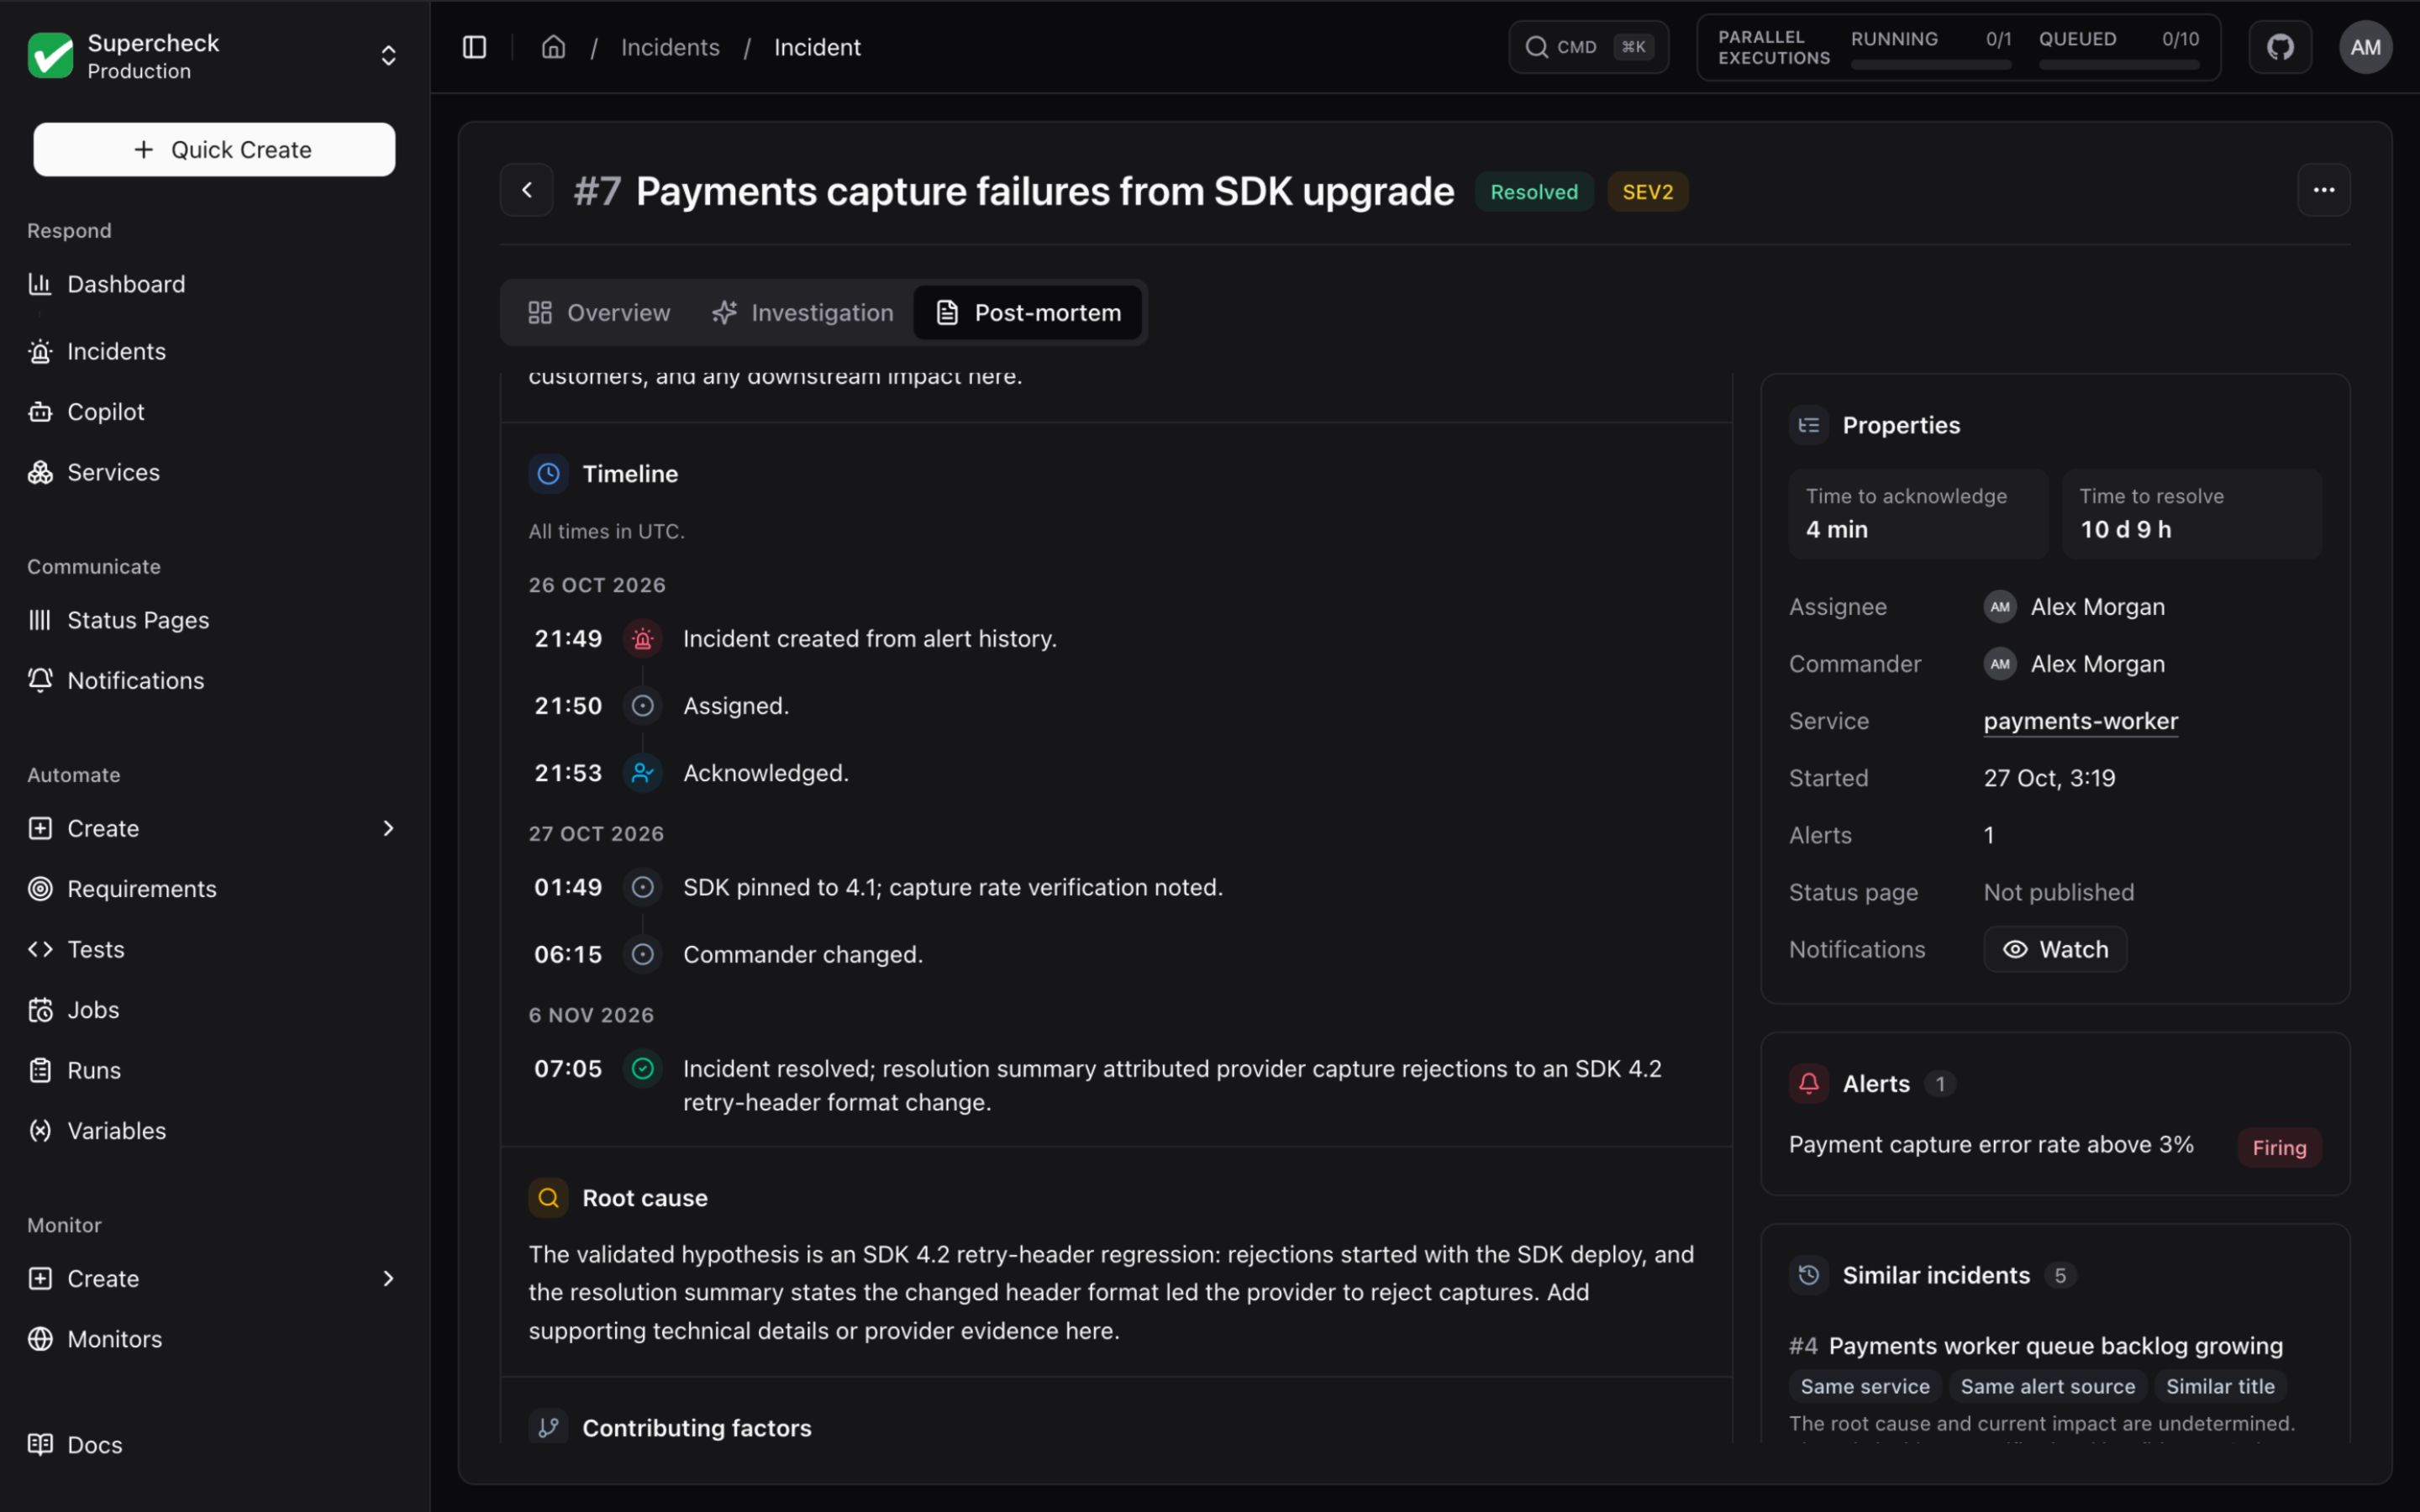
When an incident is resolved, the Post-mortem tab offers Generate post-mortem draft. The draft is built from the activity feed, the resolution summary, the hypotheses, and the evidence titles, in these sections: Summary, Impact, Timeline, Root cause, Contributing factors, and Follow-ups. It opens as a read-only document; a section with nothing in it shows Not written yet.
The Timeline lists the key moments in UTC, named as in the Activity feed: when the incident was created, alerts linked, AI triage and investigations, acknowledgement, notes, recovery and resolution. Evidence briefs, reassignments and edits are left out, and back-to-back investigations are shown once, as the latest result. The tab shows the timeline grouped by day. Each moment has its time in a bold column on the left, an icon that matches the Activity feed (or fits the sentence), and what happened, with "All times in UTC" stated once at the top. It reads lines such as - 6 Oct 2026, 14:58 UTC: <what happened> and ISO timestamps such as - 2026-10-26T23:49:24Z — <what happened>; if any line has another shape, the tab shows the text as written. When an incident has no stored evidence, the "no evidence yet" notice is not used as the root cause, the resolution or a timeline detail.
| Behavior | Detail |
|---|---|
| Drafting | If AI is unavailable, your organization's usage limit is reached, or the model returns something unusable, a template filled from the incident record is used instead. Sections without recorded facts are left empty for you to fill in. Nothing is invented |
| Editing | Edit turns every section into a text field. Follow-ups are a list you can add to and remove from. Save post-mortem keeps your edits; Cancel discards them. Unsaved edits survive switching tabs |
| Regenerate / Export | Regenerate draft replaces the text after you confirm. The download button (Export Markdown) next to it saves a .md file |
| Limits | Five drafts per person per incident per hour. Drafting needs permission to update incidents; people with view access can read and export |
Review the draft before sharing it. The Activity feed and resolution summary remain the record of what happened.