
Dashboard
Project overview, real-time metrics, and recent activityEdit
The Dashboard gives you a single view of your project's health: requirements coverage, tests, jobs, monitors, usage, failed runs, and open incidents. The status pill in the header shows Operational or Issues Detected and lists every current issue (down monitors, failed runs in the last 24 hours, and execution queue capacity).
Looking for k6 or Playwright job analytics? They are on the Runs page.
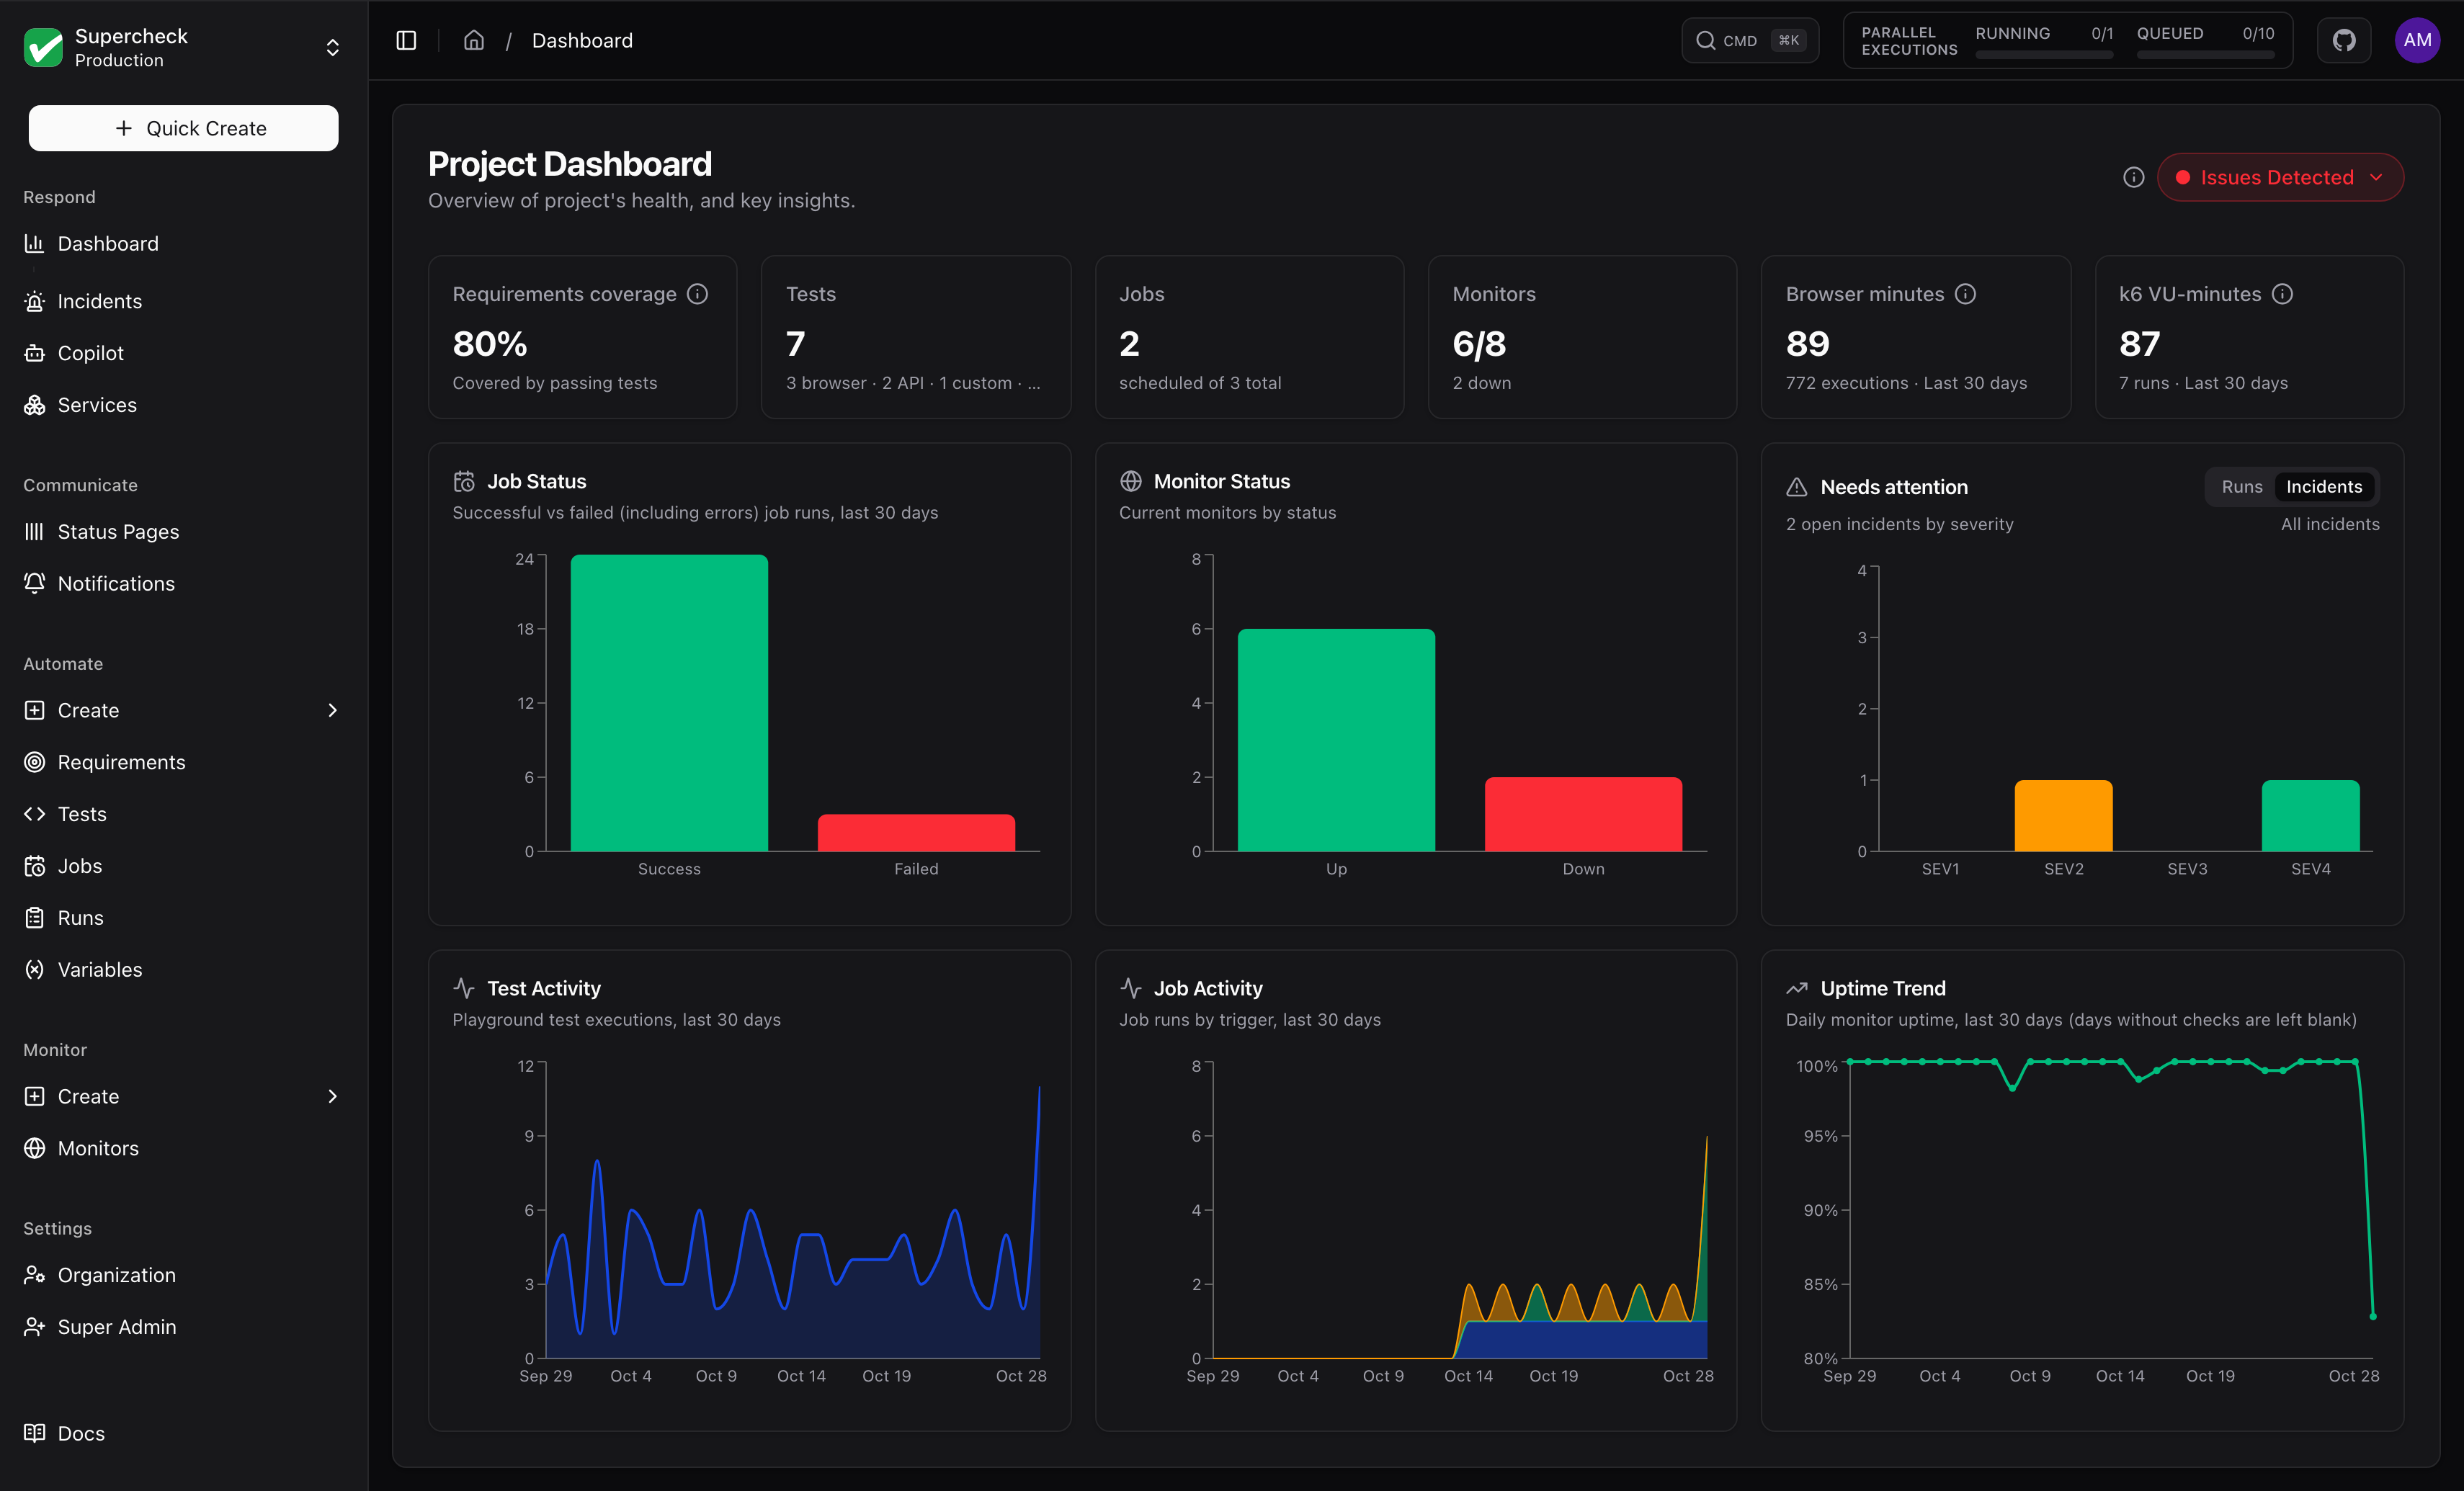
Key Metrics
| Metric | Description |
|---|---|
| Requirements coverage | Share of requirements covered by passing tests, with the number of high priority requirements at risk |
| Tests | Test cases saved in your project, with a breakdown by test type |
| Jobs | Jobs with a schedule configured, out of all jobs |
| Monitors | Monitors currently up, out of all monitors |
| Browser minutes | Playwright execution time used over the last 30 days from Playwright job runs (k6 jobs are excluded), synthetic monitor checks and playground tests |
| k6 VU-minutes | k6 virtual-user minutes used over the last 30 days (job runs and playground runs) |
Usage cards are estimated from this project's recorded run durations and link to the matching analytics view on the Runs page. Billed usage is metered per organization and billing period, so it can differ.
Execution queue capacity reflects your organization's running and queued executions across its projects.
Needs Attention
A card with a Runs tab (failed job runs from the last 7 days, by trigger) and an Incidents tab (open incidents by severity). The Incidents tab is hidden when incidents are unavailable or you lack access. Each tab links to the full list.
Charts
| Chart | Shows |
|---|---|
| Job Status | Successful vs failed job runs over the last 30 days. Runs that ended in an error count as failed. Blocked runs and k6 job runs are not included. |
| Monitor Status | Current monitors by status: Up, Down, Error, Maintenance, Pending, and Paused. Only statuses with monitors are shown. |
| Test Activity | Playground test executions per day over the last 30 days. |
| Job Activity | Playwright job runs per day by trigger: Manual, Scheduled, or Remote (API/CI). k6 job runs are not included. |
| Uptime Trend | Daily monitor uptime over the last 30 days. Days without monitor checks are left blank rather than estimated. With no checks there is no uptime figure rather than 100%. |
Dashboard uptime counts each location's result separately, so it can differ from a monitor's own Uptime for multi-location monitors.