Performance Test
k6 load testing from multiple regionsEdit
Run k6 performance tests to validate your application under load. Execute from multiple regions worldwide.
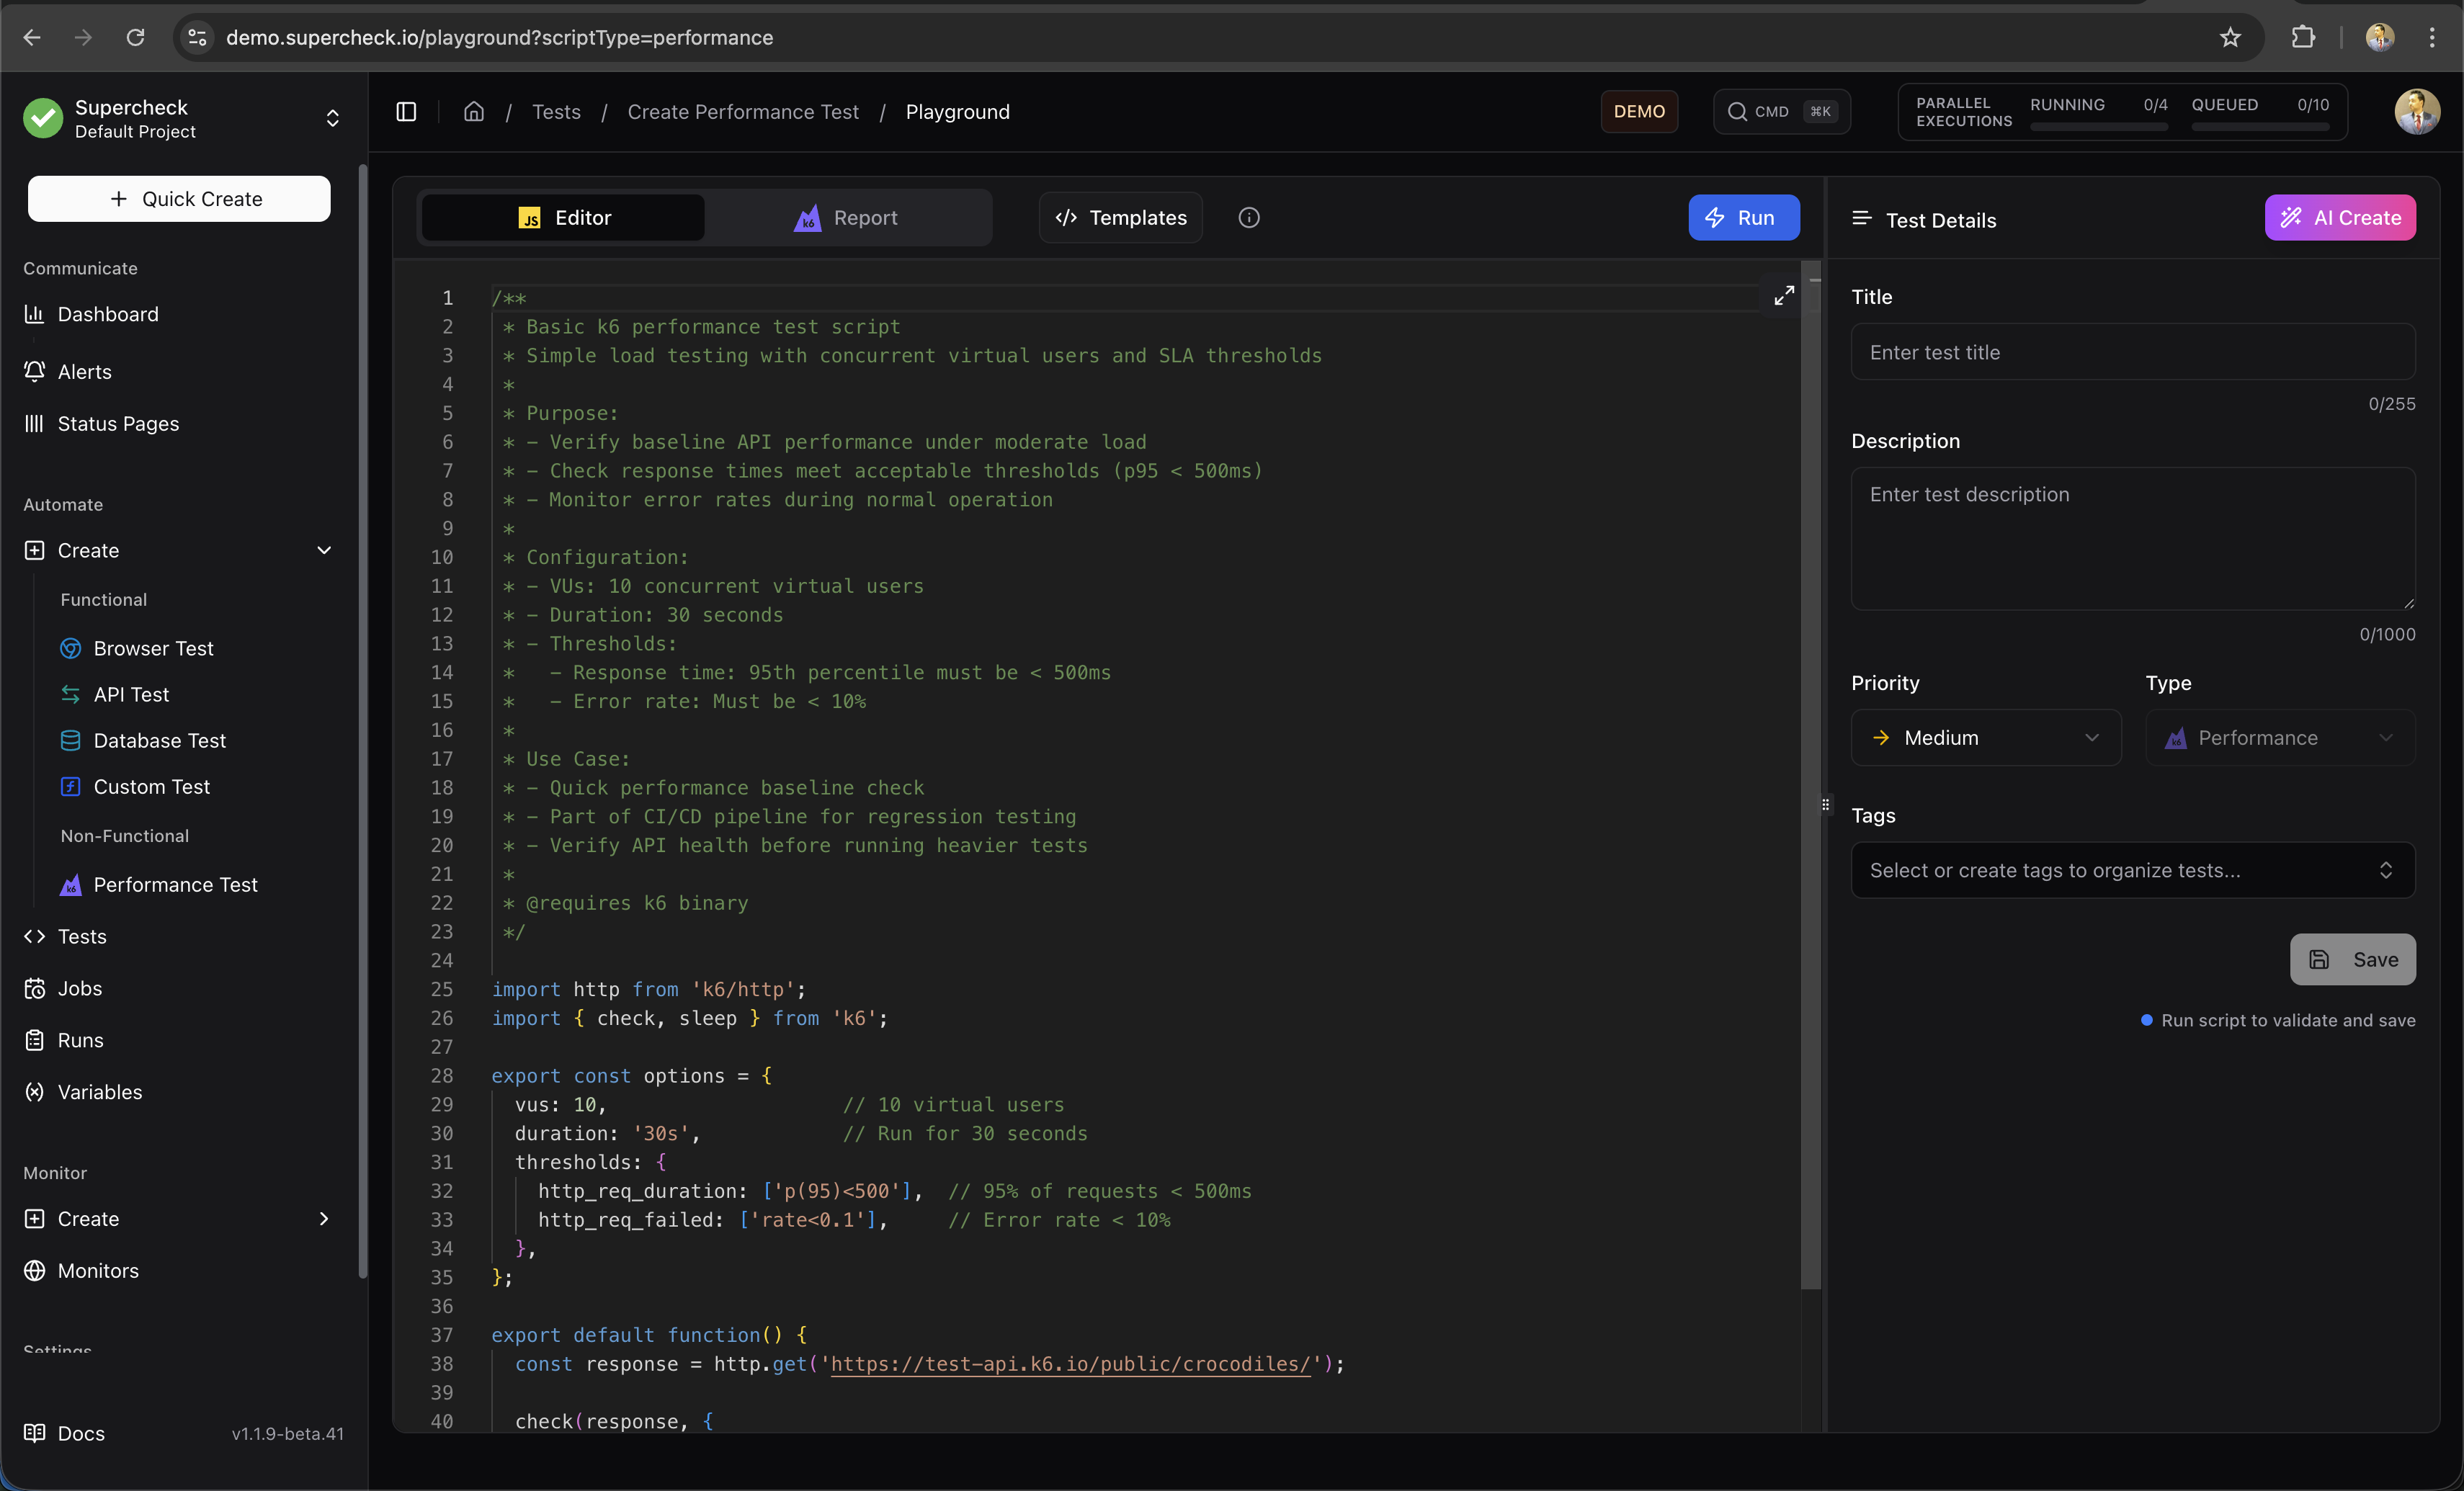
Create Test
- Go to Create → Performance Test
- Write k6 script in the editor
- Configure load profile (VUs, duration)
- Select regions for distributed testing
- Run and analyze results
Multi-Location Testing
Run tests from multiple regions simultaneously to measure global performance.
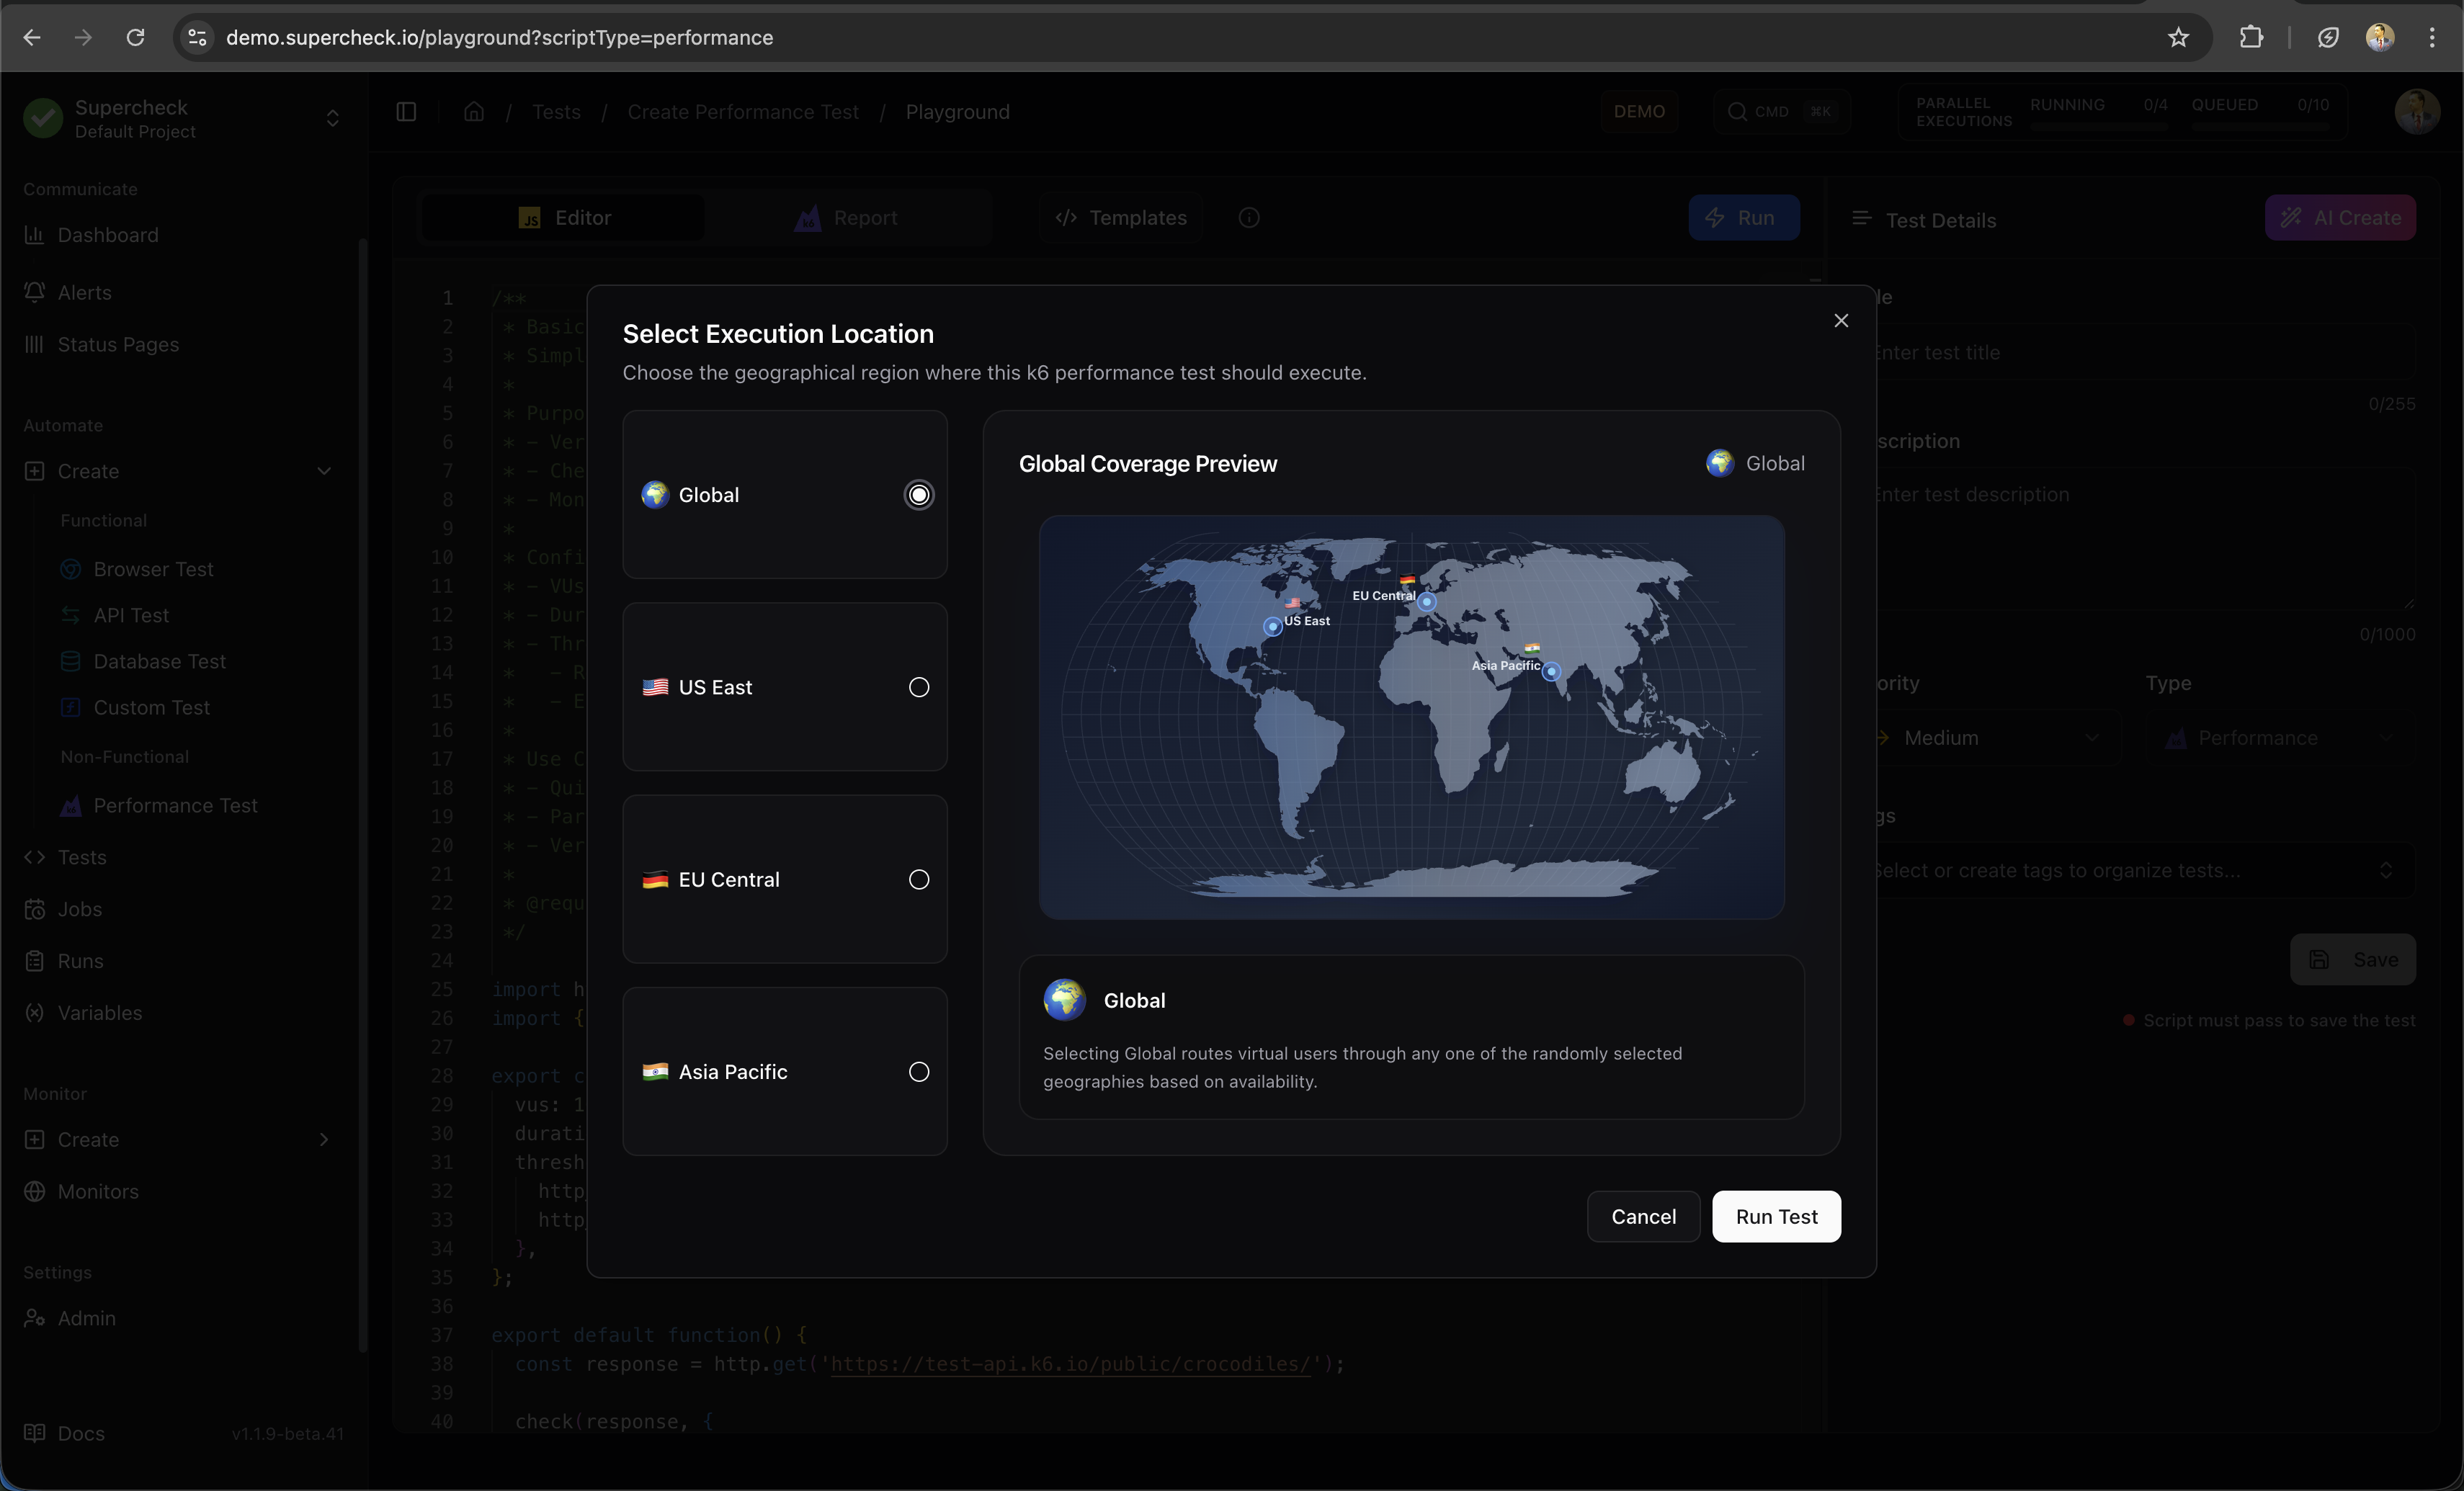
| Region | Location |
|---|---|
| US East | Ashburn, USA |
| EU Central | Nuremberg, Germany |
| Asia Pacific | Singapore |
Execution Context:
- Playground: Select specific location (US East, EU Central, or Asia Pacific) for manual test runs
- Jobs: Use global queue—tests execute from any available worker regardless of location
Self-Hosted Deployments: In self-hosted mode, all region selections execute from your single worker instance. You can still select multiple regions for configuration purposes, but tests run from one location. To enable true multi-region testing, deploy workers in each target region.
Example Script
/**
 * Ramping load profile to mirror real traffic patterns.
 *
 * Purpose:
 * - Simulate a gradual increase in traffic (ramp-up)
 * - Hold traffic at peak load (steady state)
 * - Gradually decrease traffic (ramp-down)
 *
 * Configuration:
 * - Stages:
 *   1. Ramp up to 10 VUs over 2 minutes
 *   2. Ramp up to 50 VUs over next 5 minutes
 *   3. Ramp up to 80 VUs over next 3 minutes
 *   4. Ramp down to 0 VUs over 2 minutes
 * - Thresholds: Strict latency and error limits
 *
 * @see https://grafana.com/docs/k6/latest/using-k6/scenarios/
 */
import http from 'k6/http';
import { check } from 'k6';

export const options = {
  stages: [
    { duration: '2m', target: 10 },   // Ramp-up to 10 VUs
    { duration: '5m', target: 50 },   // Increase to 50 VUs
    { duration: '3m', target: 80 },   // Peak load at 80 VUs
    { duration: '2m', target: 0 },    // Ramp-down
  ],
  thresholds: {
    http_req_failed: ['rate<0.02'],              // Error rate < 2%
    http_req_duration: ['p(95)<600', 'p(99)<1200'], // Latency thresholds
    checks: ['rate>0.95'],                       // 95% of checks pass
  },
};

export default function () {
  const baseUrl = 'https://test-api.k6.io';
  const response = http.get(baseUrl + '/public/crocodiles/');

  check(response, {
    'status is 200': (res) => res.status === 200,
    'p95 under budget': (res) => res.timings.duration < 600,
  });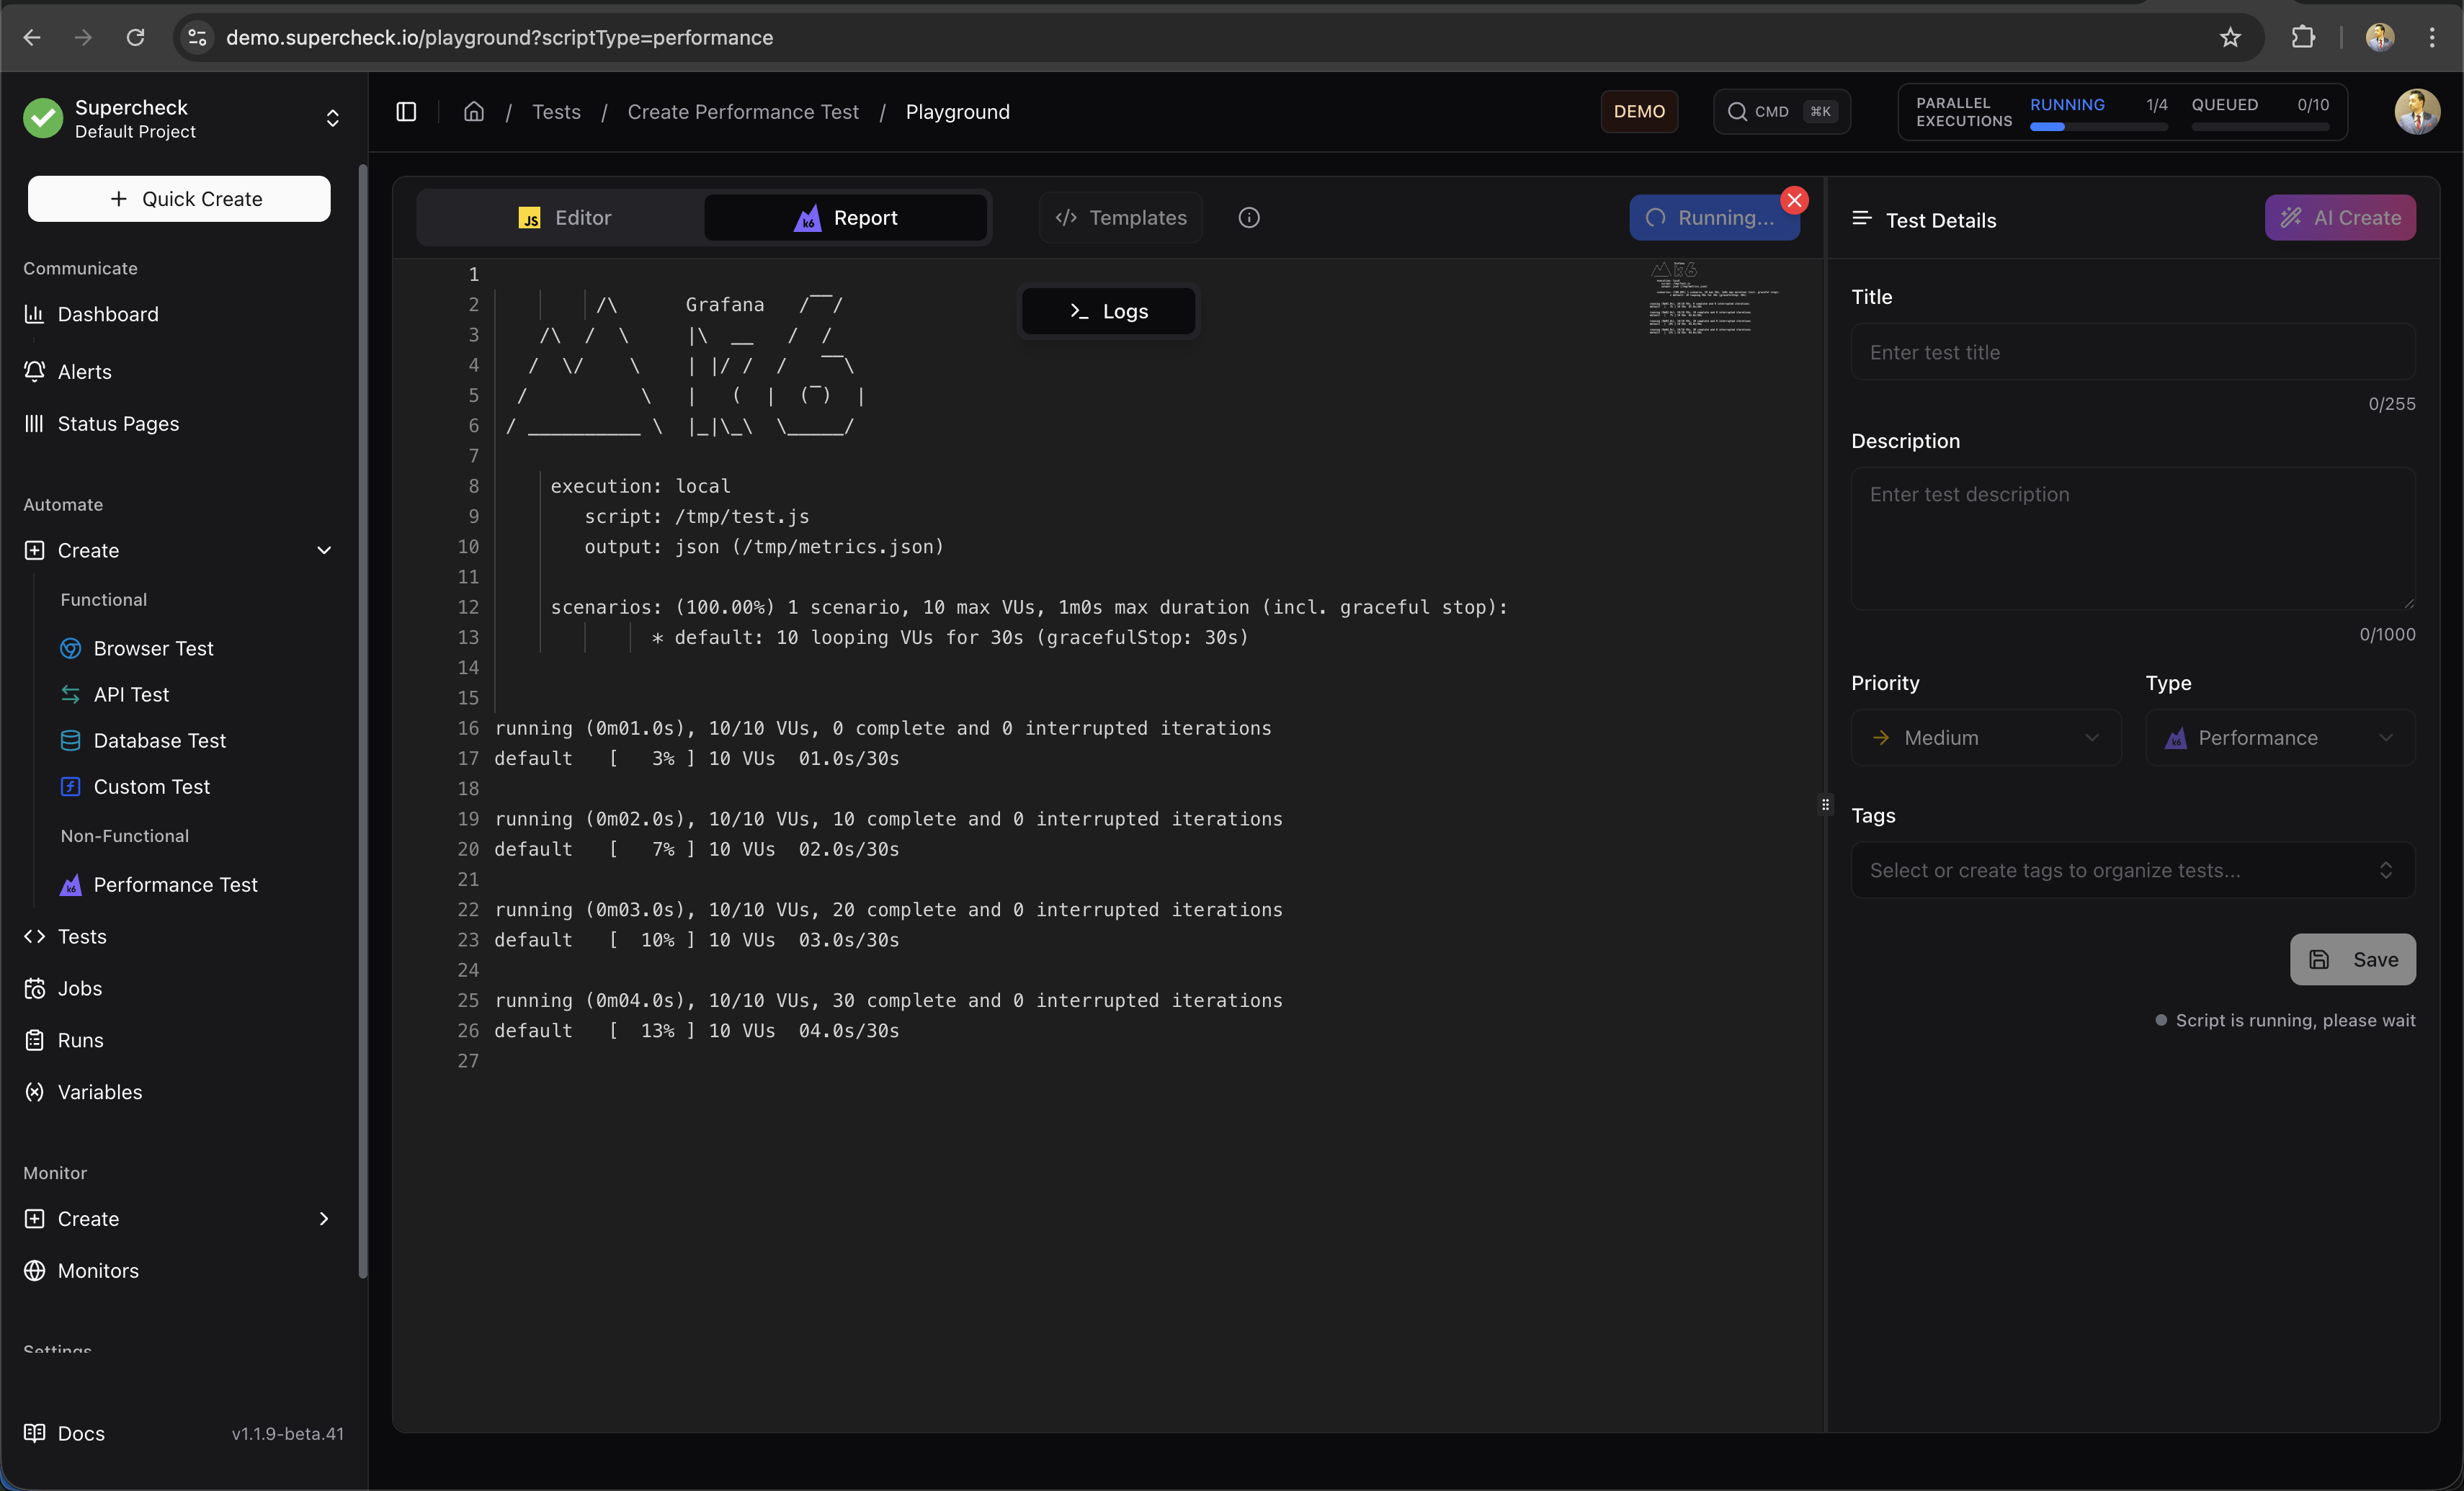
}Streaming Logs
Watch real-time execution logs as the test runs.
Results & Logs
View detailed logs after test completion.
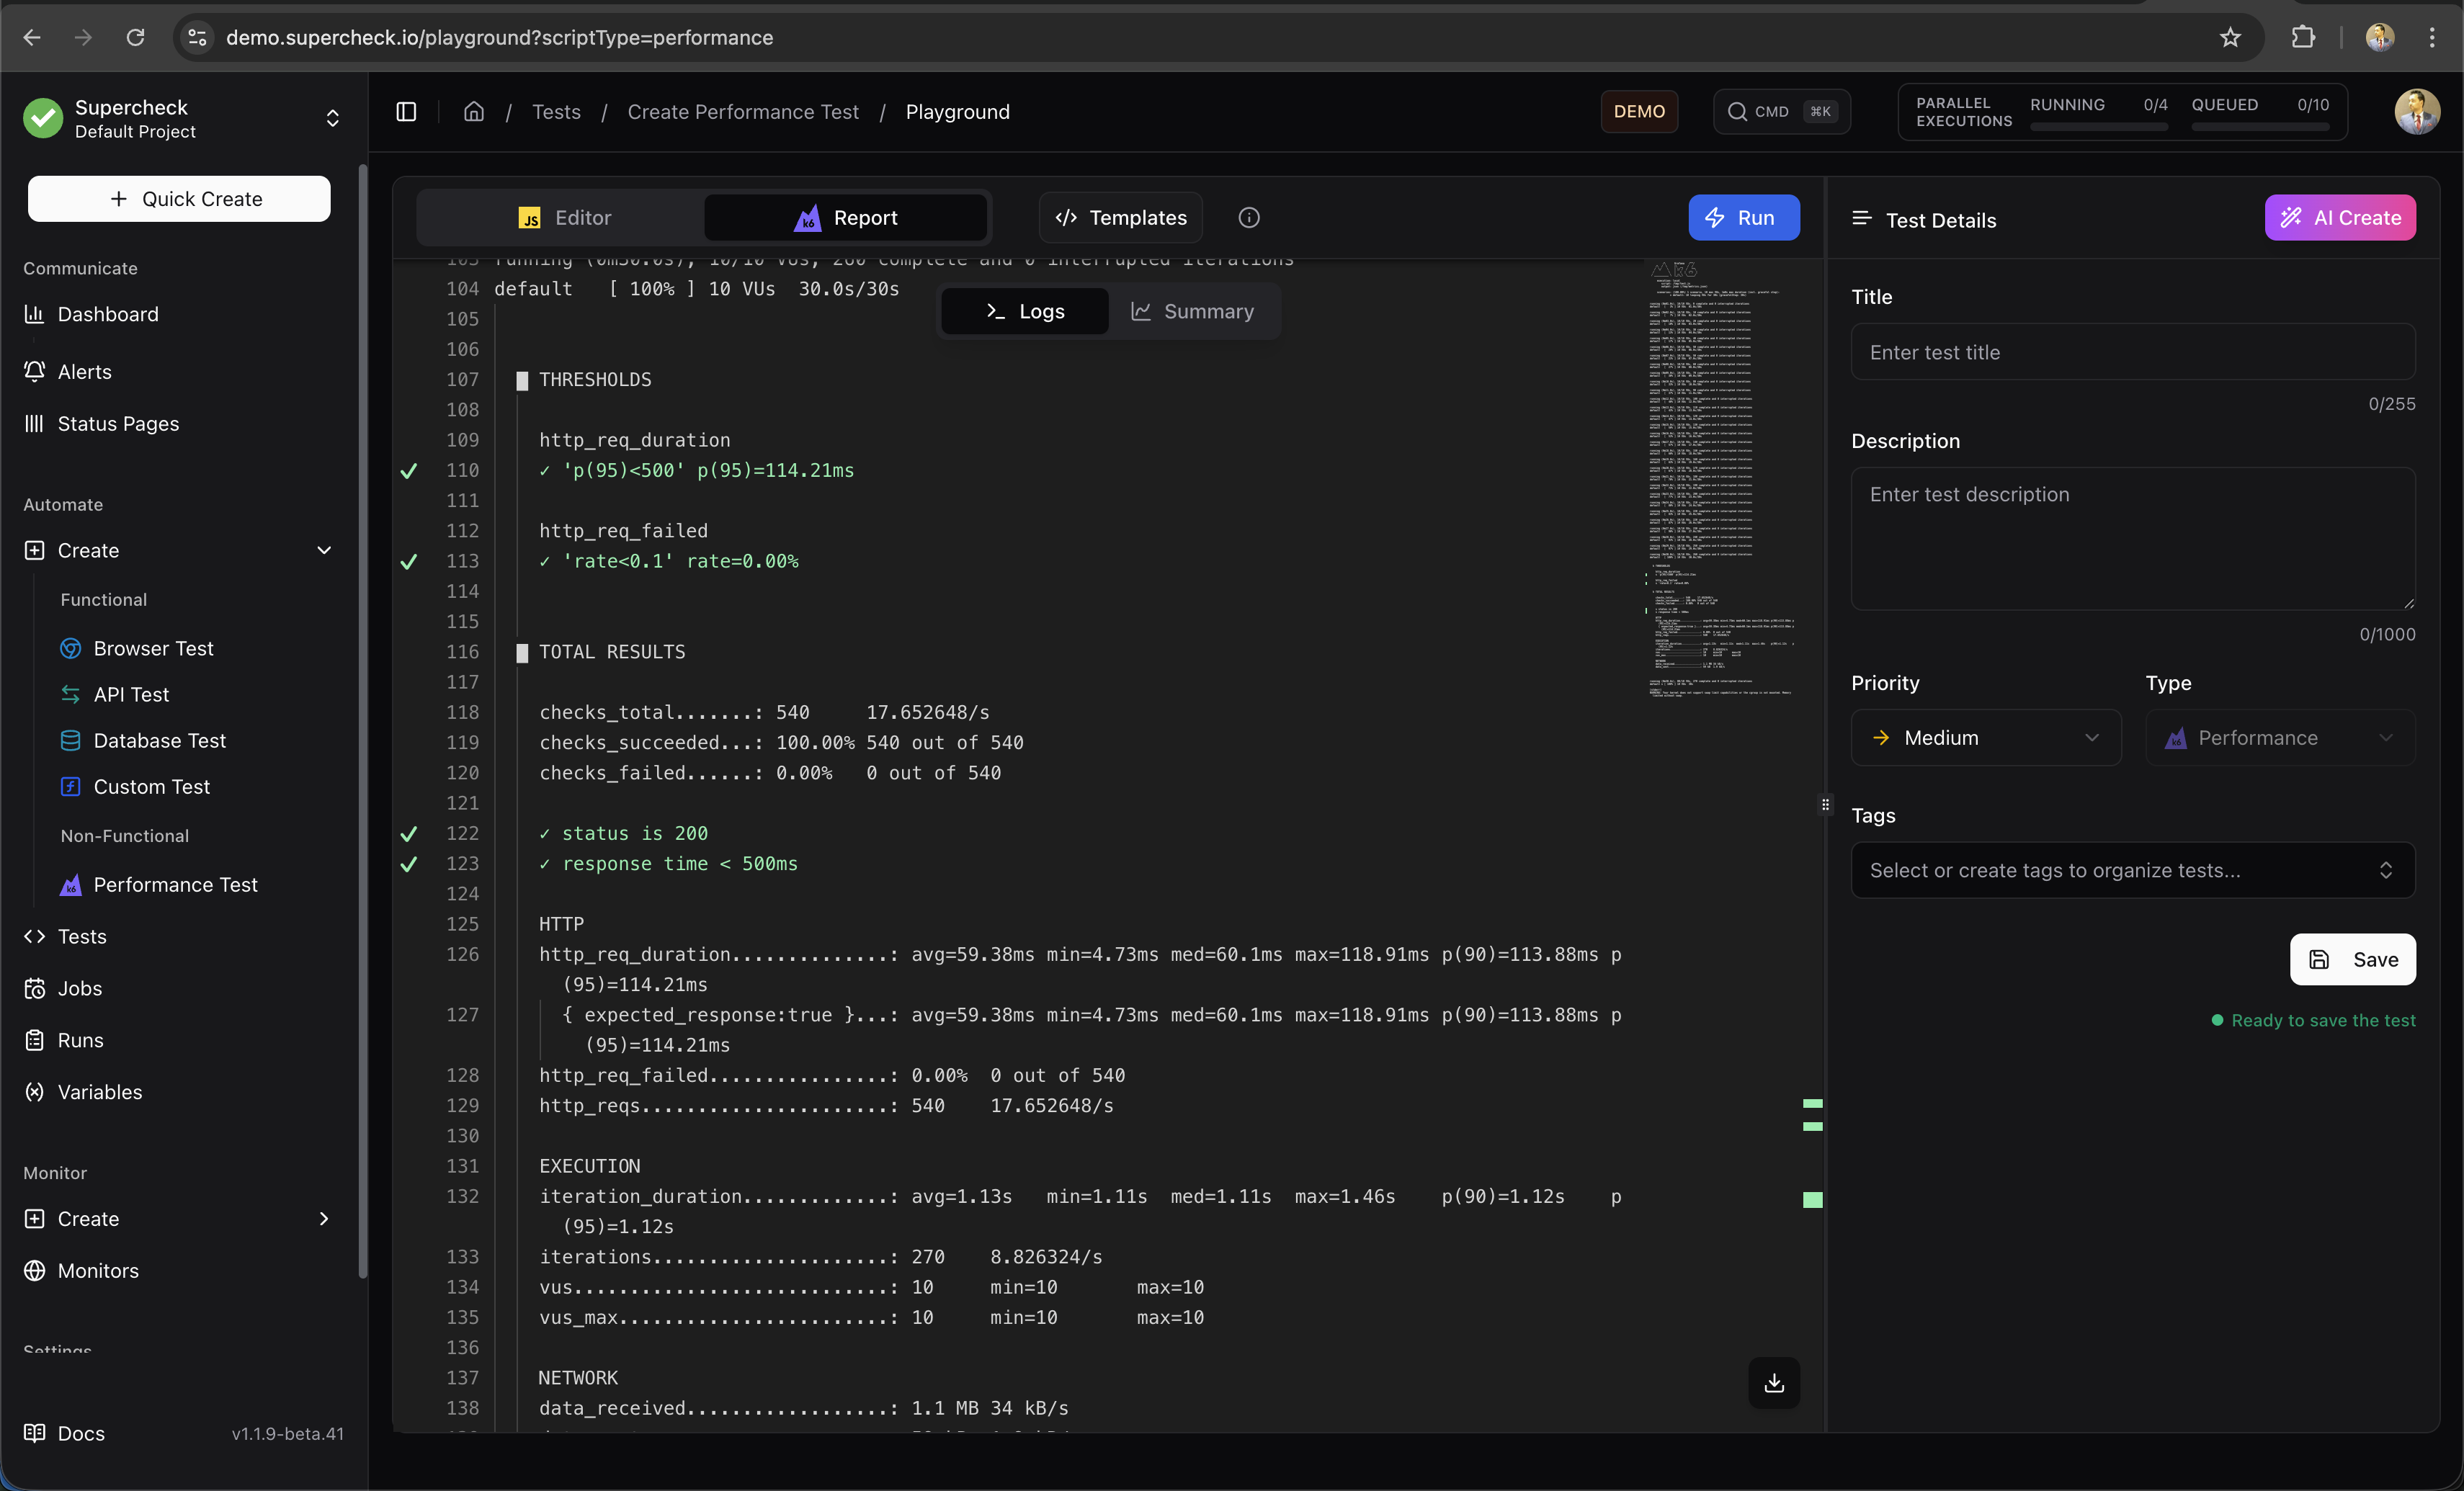
Reports
Analyze performance metrics after the test completes.
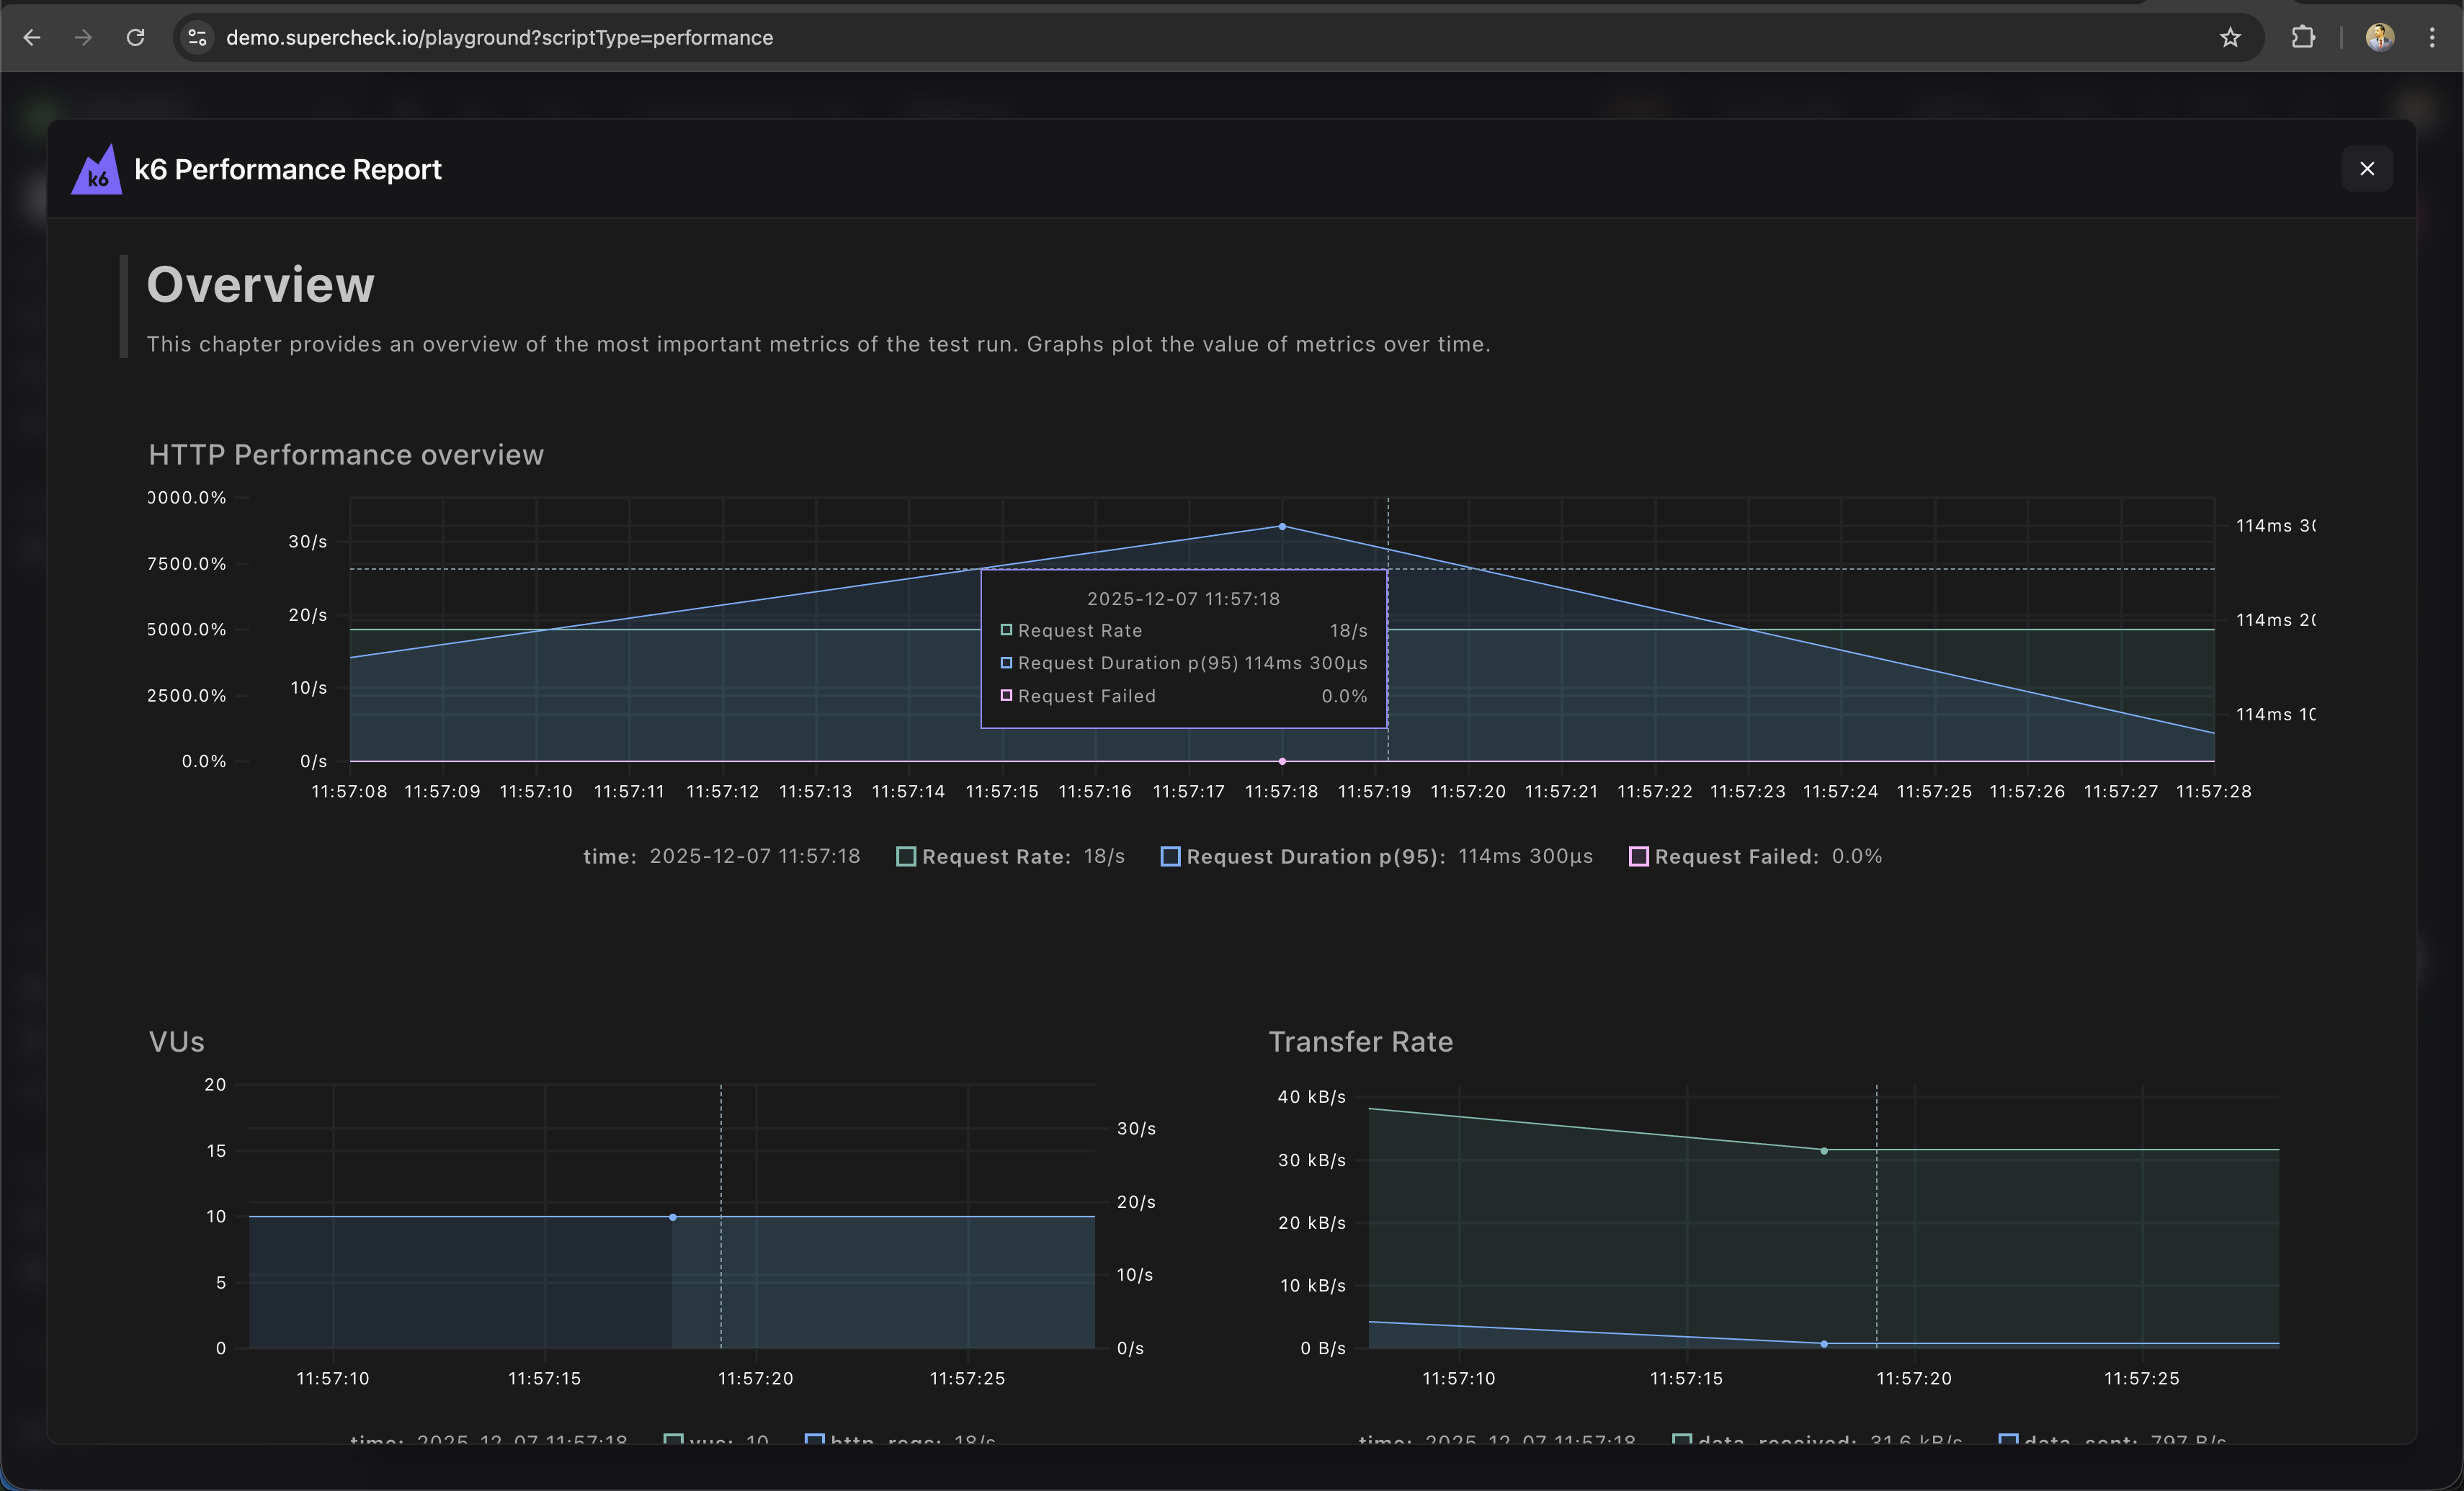
Metrics include:
- Request rate — Requests per second
- Response time — p50, p95, p99 latencies
- Error rate — Failed requests percentage
- Throughput — Data transferred
Load Profiles
| Profile | Use Case |
|---|---|
| Smoke | 1-2 VUs, 1 min — Verify script works |
| Load | 10-50 VUs, 5-10 min — Normal load |
| Stress | 100+ VUs, 10-30 min — Find breaking point |
| Spike | Sudden ramp, 5 min — Handle traffic bursts |
Thresholds
Set pass/fail criteria:
/**
 * Thresholds define pass/fail criteria for your test.
 * @see https://grafana.com/docs/k6/latest/using-k6/thresholds/
 */
thresholds: {
  http_req_duration: ['p(95)<500'],  // 95% under 500ms
  http_req_failed: ['rate<0.01'],    // Less than 1% errors
}Using Variables
/**
 * Using project variables and secrets in k6 tests.
 * Secrets require .toString() to access the value.
 */
export default function () {
  const baseUrl = getVariable('API_URL');
  const apiKey = getSecret('API_KEY').toString();

  const response = http.get(`${baseUrl}/protected`, {
    headers: { Authorization: `Bearer ${apiKey}` }
  });

  check(response, { 'status is 200': (r) => r.status === 200 });
}
Learn More
- k6 Documentation — Complete k6 guide
- k6 HTTP Requests — Making HTTP calls
- k6 Thresholds — Pass/fail criteria
- k6 Checks — Response validation