Quick Start
Get started with Supercheck in minutesEdit
This guide walks you through creating your first test, setting up monitoring, and configuring alerts. By the end, you'll have automated testing and monitoring running for your application.
Prerequisites
- A running Supercheck instance (self-hosted or cloud)
- A web application or API to test
Step 1: Create Your First Test
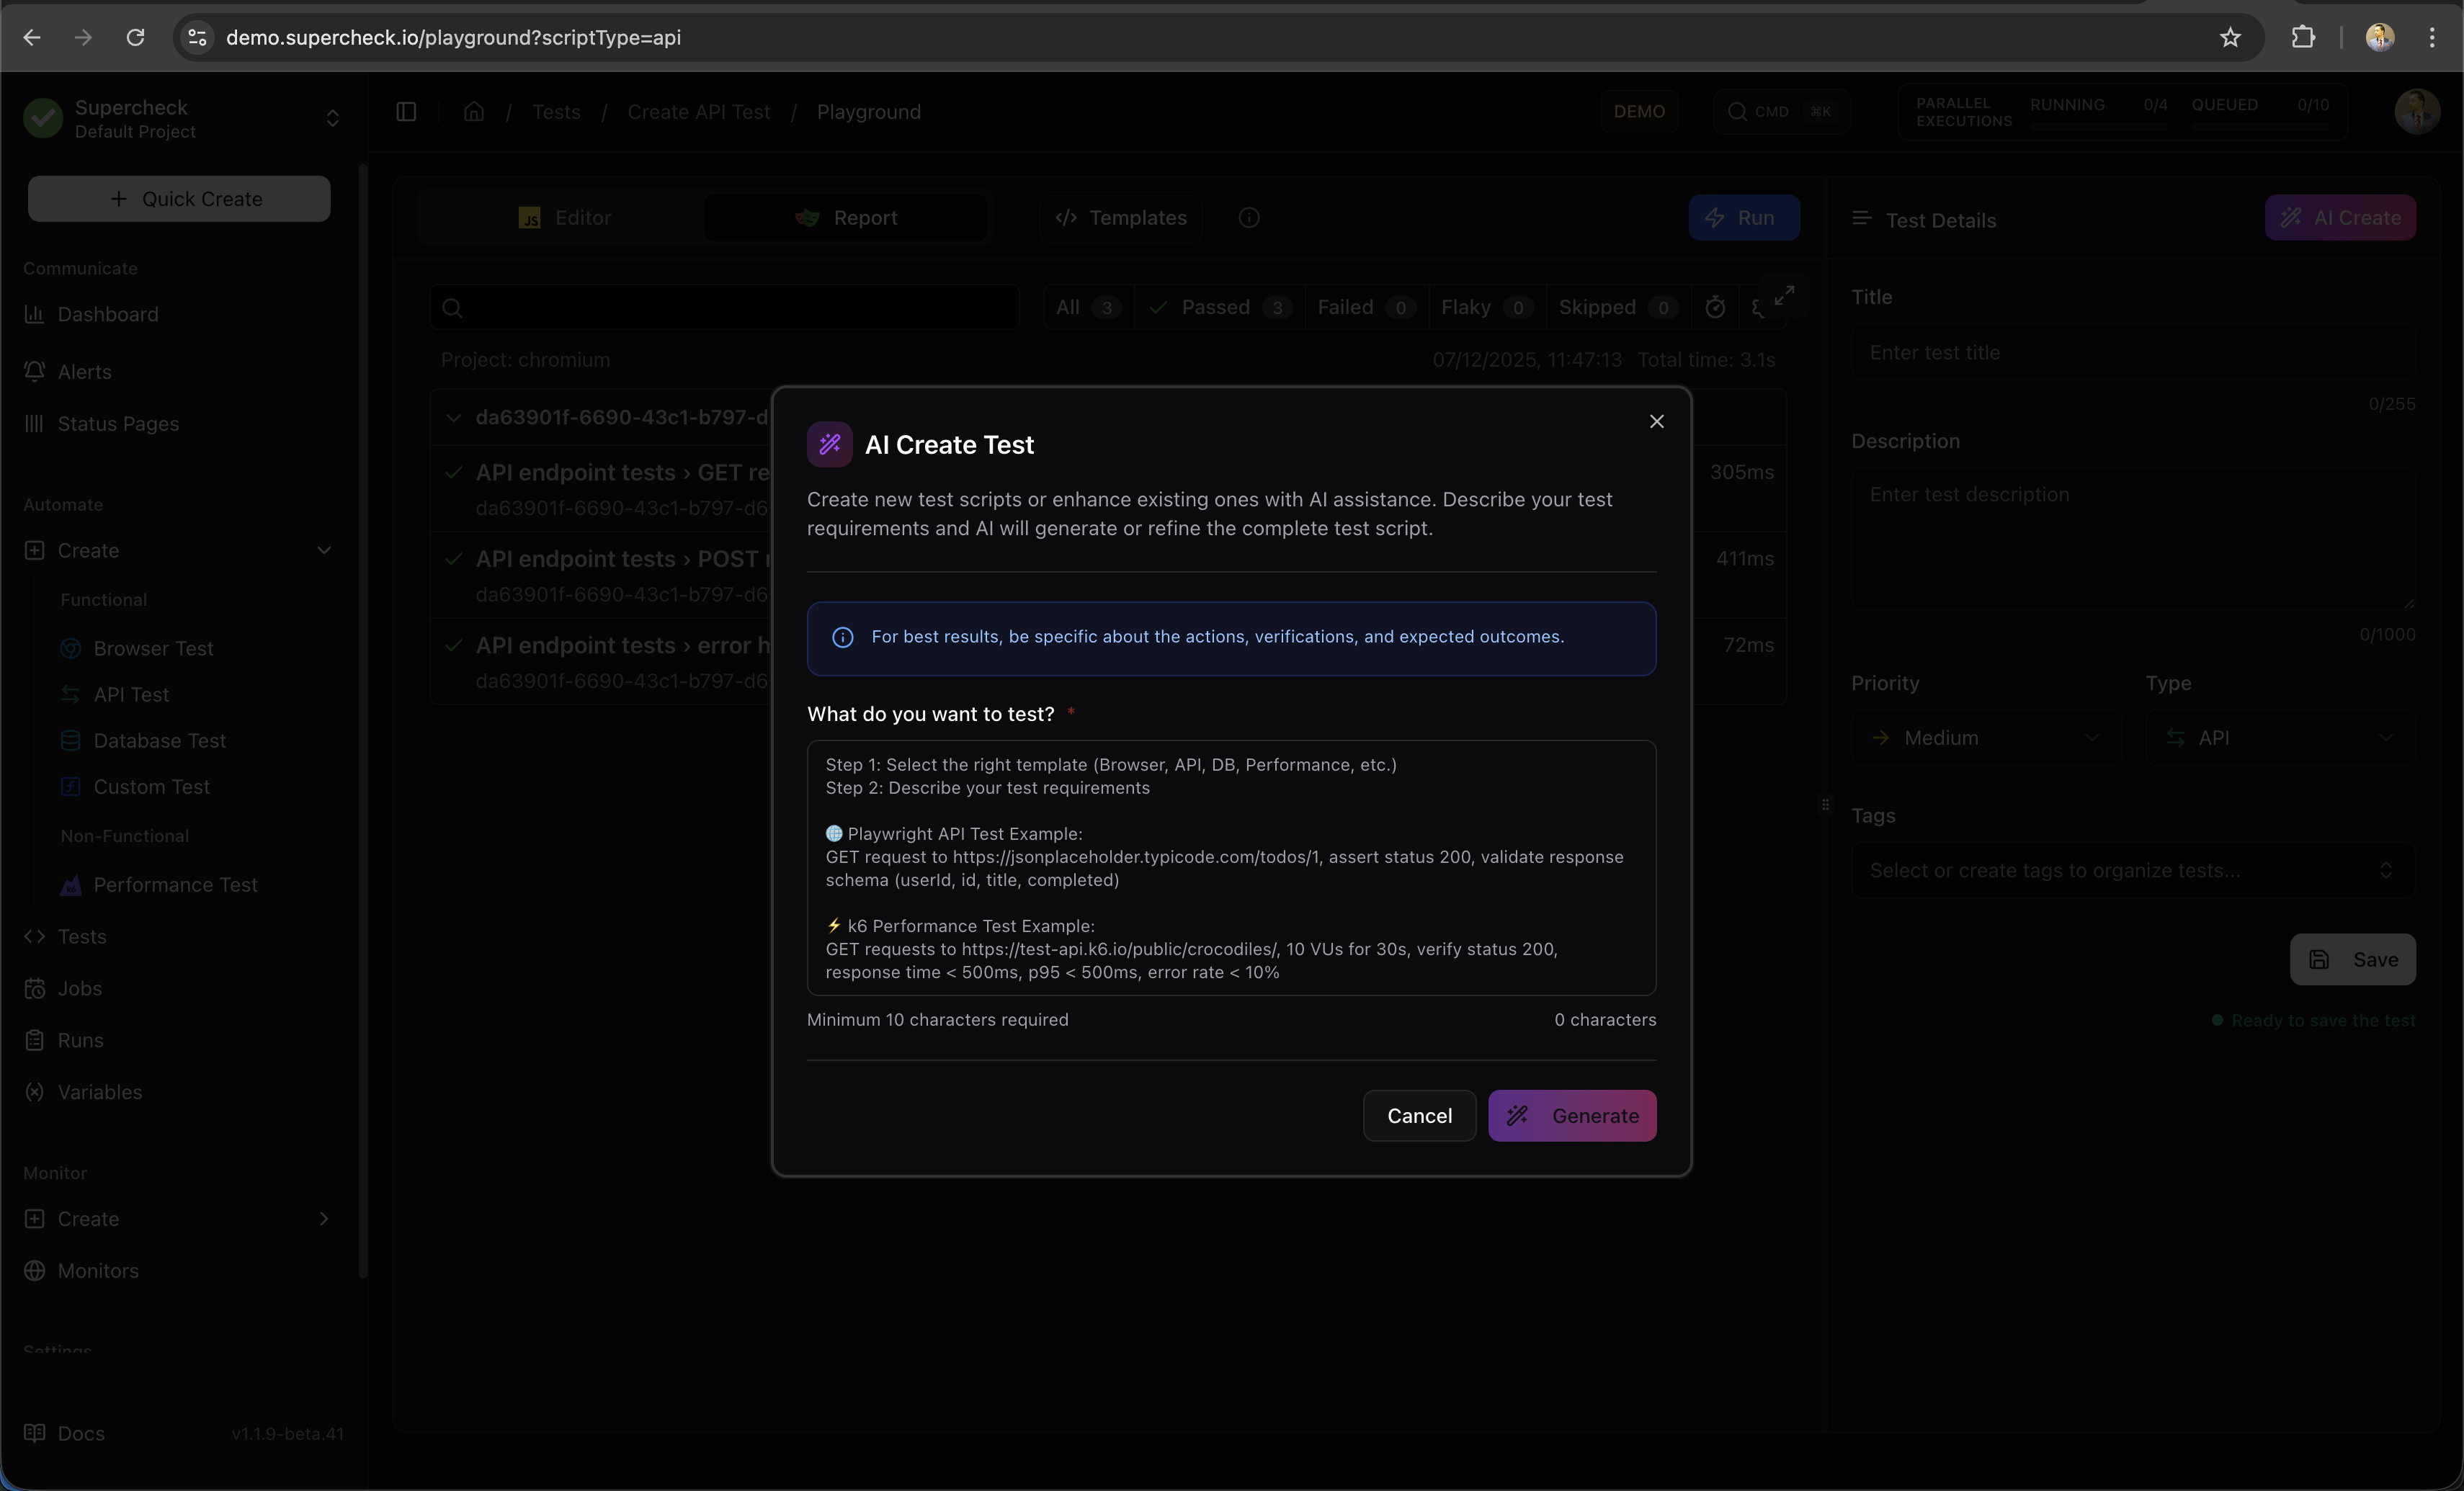
The fastest way to create a test is using the Playground with AI assistance.
Option A: Use AI Create
- Go to Create → Browser Test to open the Playground
- Click the AI Create button (purple gradient)
- Describe what you want to test:
Test that the homepage loads and displays the main heading - Review the generated code
- Click Accept to use it
Tip: AI Create for browser tests is in beta. For complex flows, consider recording your test first with Playwright Codegen or Playwright Browser Extension, then use AI to enhance it.
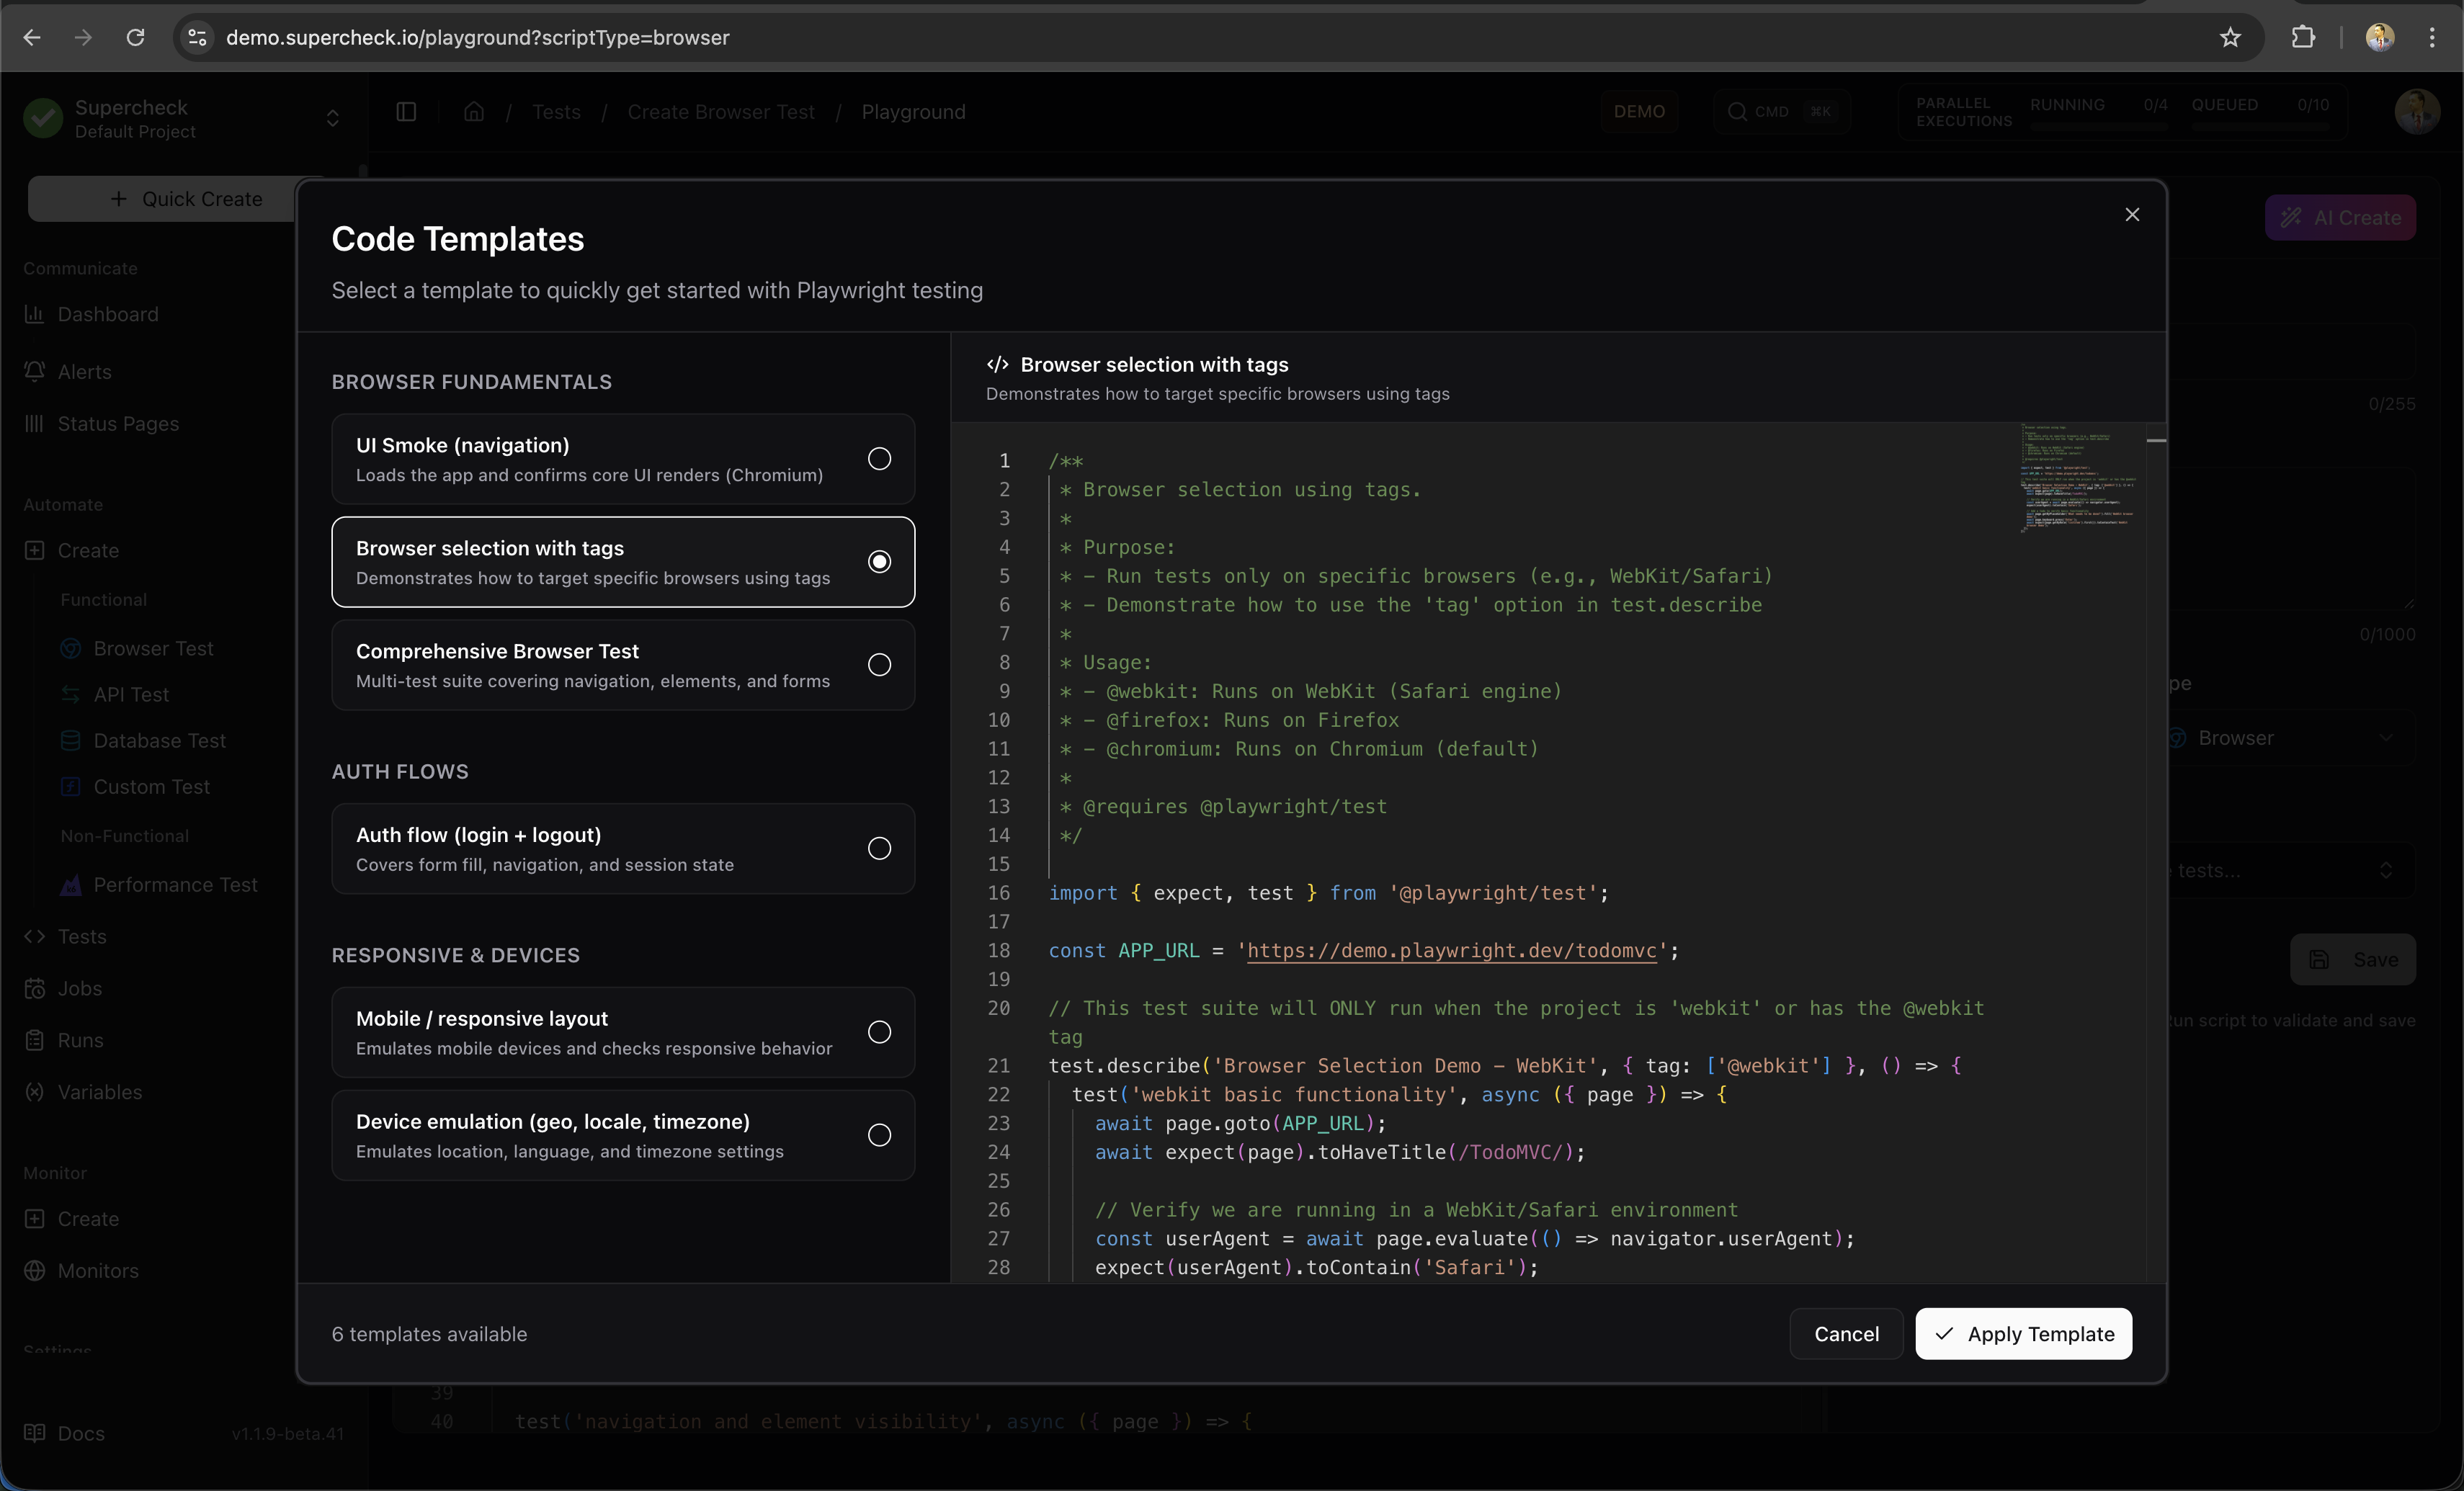
Option B: Use a Template
- Go to Create → Browser Test
- Click Templates in the toolbar
- Select a template (e.g., "Basic Page Load")
- Customize the URL and assertions
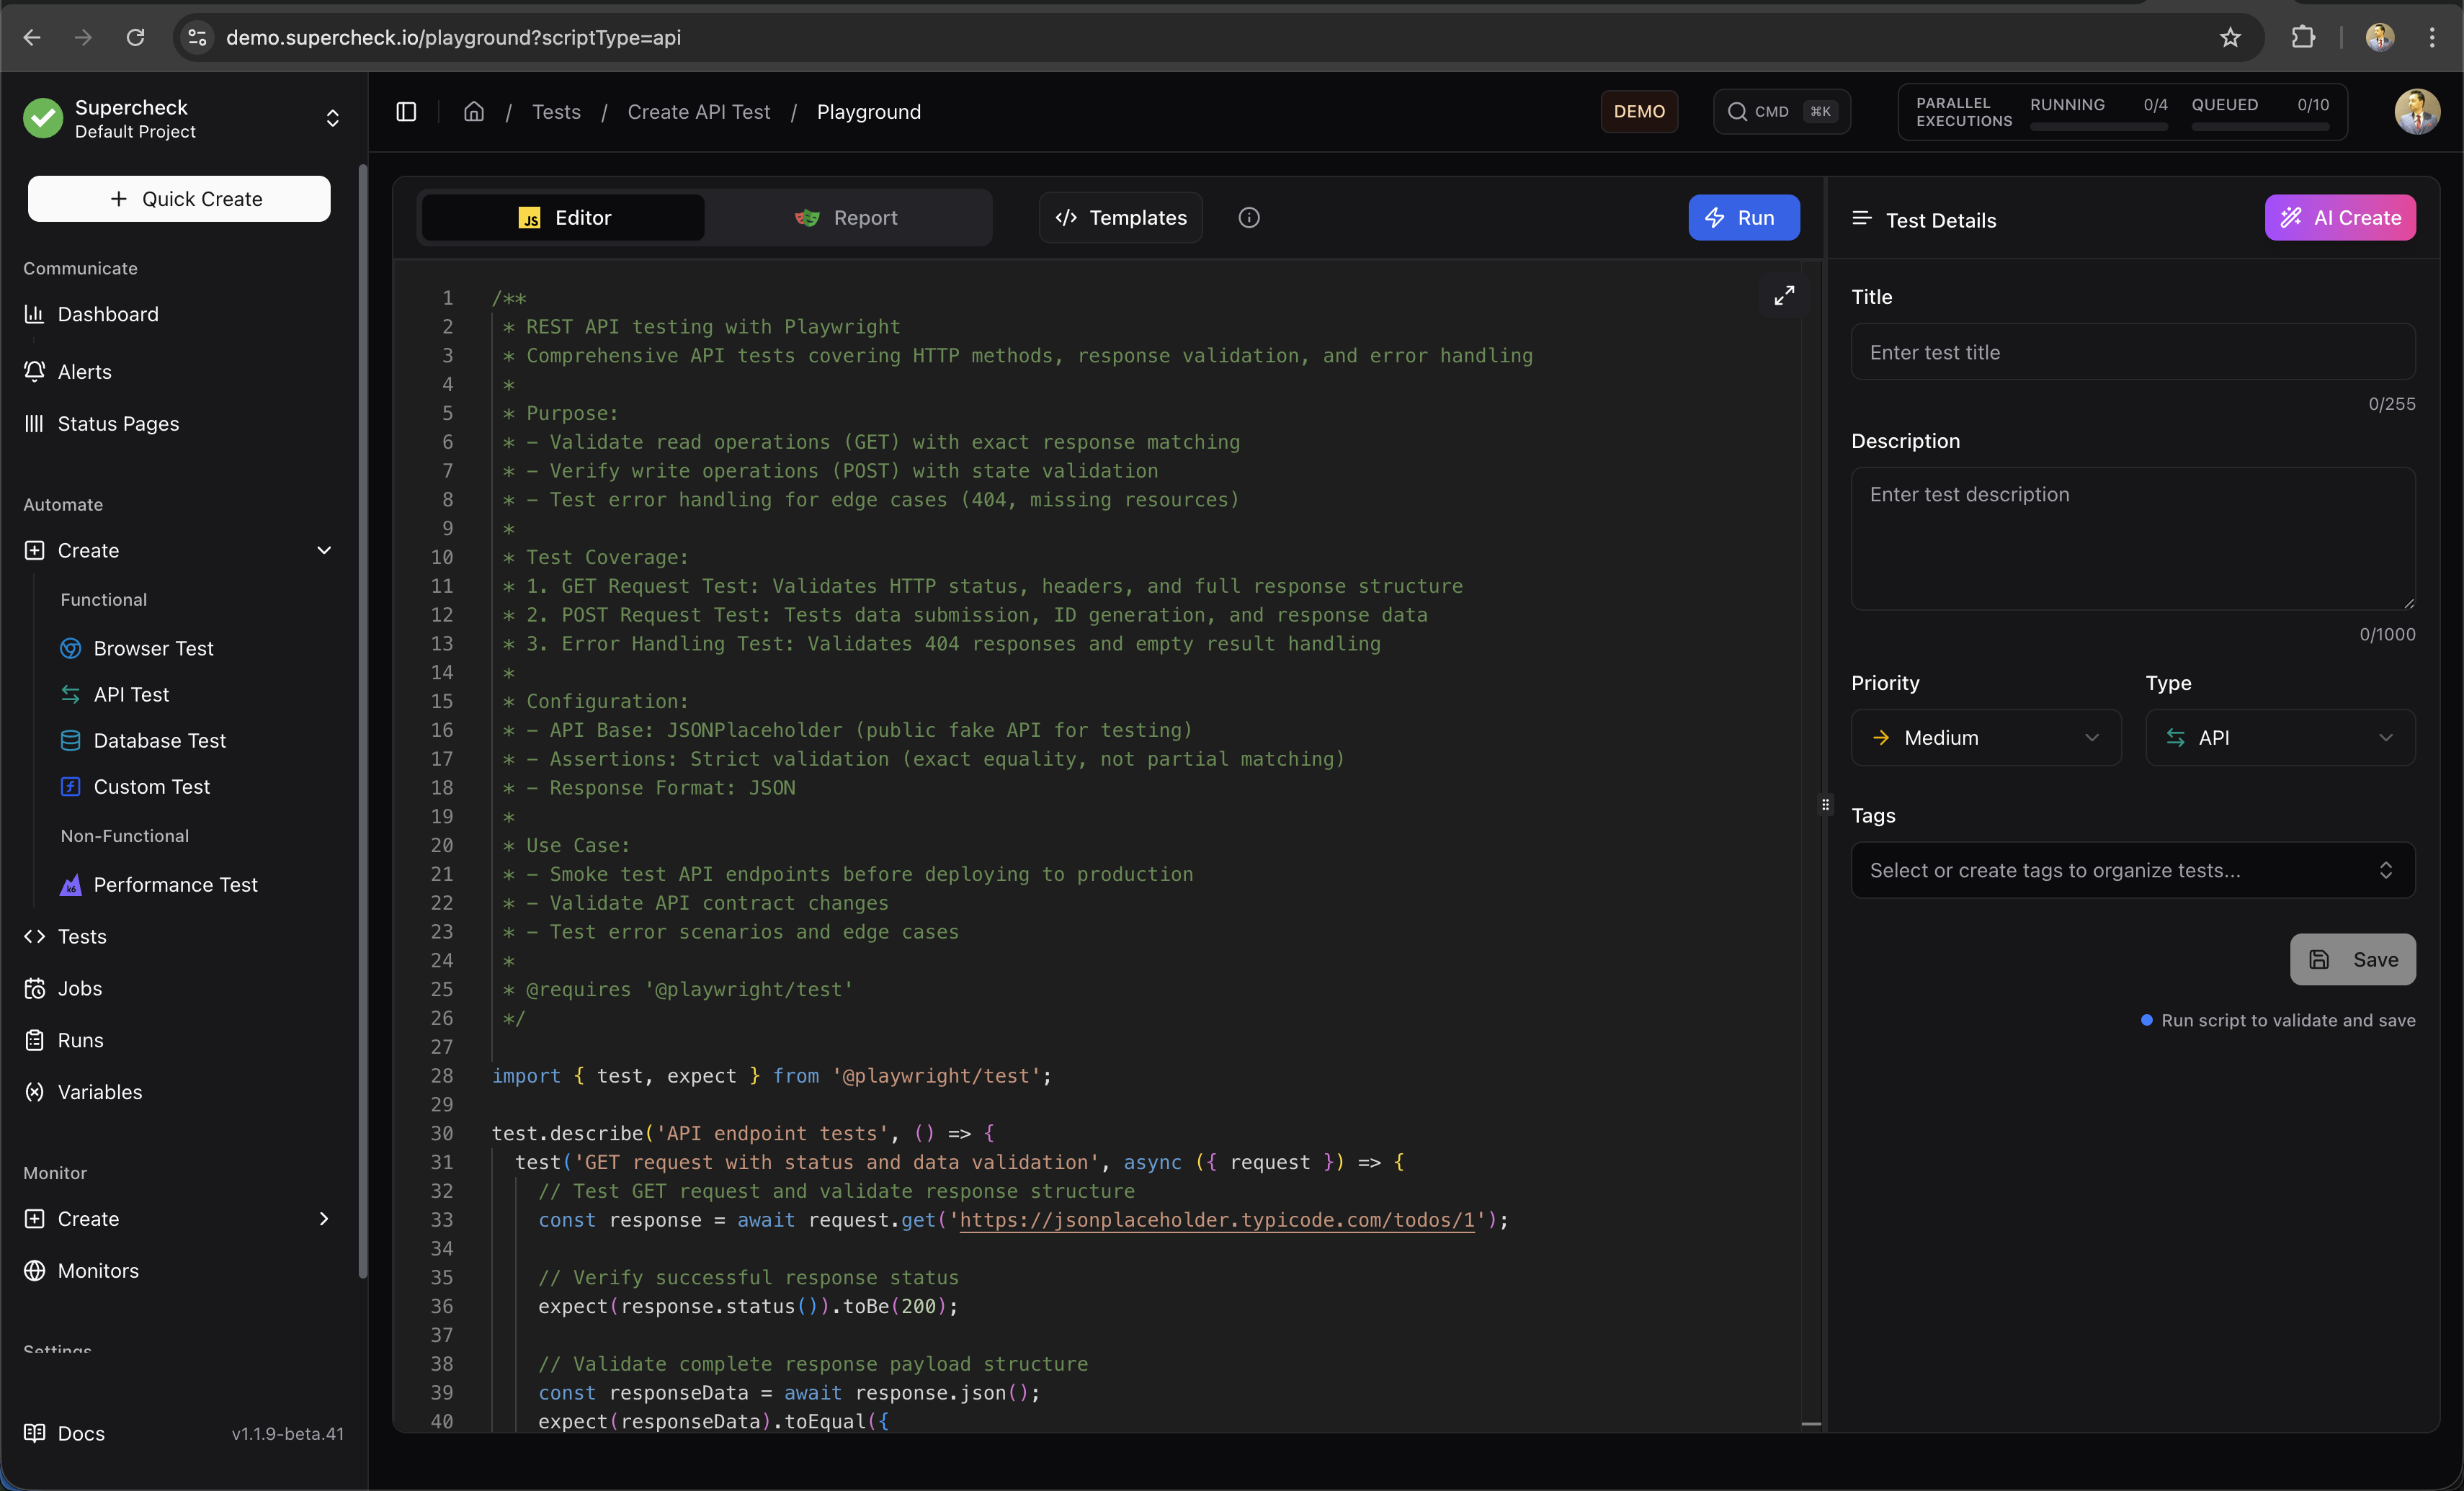
Option C: Write from Scratch
Copy this example and modify for your application:
/**
 * Playwright UI smoke test.
 *
 * Purpose:
 * - Verify that the application loads correctly
 * - Check that critical UI elements are visible
 * - Perform a basic user interaction
 *
 * @see https://playwright.dev/docs/writing-tests
 */
import { expect, test } from '@playwright/test';

const APP_URL = 'https://demo.playwright.dev/todomvc';

test.describe('UI smoke test', () => {
test('home page renders primary UI', async ({ page }) => {
// Navigate to the application
await page.goto(APP_URL);

    // Verify page title and input visibility
    await expect(page).toHaveTitle(/TodoMVC/);
    await expect(page.getByPlaceholder('What needs to be done?')).toBeVisible();

    // Perform interaction: Add a new task
    await page.getByPlaceholder('What needs to be done?').fill('Smoke task');
    await page.keyboard.press('Enter');

    // Verify the task was added to the list
    await expect(page.getByRole('listitem').first()).toContainText('Smoke task');

});
});
What this tests:
- Page loads without errors
- Title contains expected text
- Input field is visible and functional
- User interaction works correctly
/**
 * API health probe with contract checks.
 *
 * Purpose:
 * - Verify that the API is up and running (status 200)
 * - Check that the response headers are correct (Content-Type)
 * - Validate the structure and data types of the response body
 *
 * @see https://playwright.dev/docs/api-testing
 */
import { expect, test } from '@playwright/test';

const API_URL = 'https://jsonplaceholder.typicode.com';

test.describe('API health check', () => {
  test('health endpoint responds with expected payload', async ({ request }) => {
    // Send GET request
    const response = await request.get(API_URL + '/posts/1');

    // Basic status checks
    expect(response.ok()).toBeTruthy();
    expect(response.status()).toBe(200);
    expect(response.headers()['content-type']).toContain('application/json');

    // Validate JSON structure
    const body = await response.json();
    expect(body).toMatchObject({ id: 1 });
    expect(typeof body.title).toBe('string');
  });
});
What this tests:
- API endpoint is reachable
- Returns HTTP 200 with correct content type
- Response body has expected structure
/**
 * k6 smoke test for uptime and latency.
 *
 * Purpose:
 * - Verify system availability (uptime)
 * - Check basic latency performance
 * - Ensure the system is ready for heavier load tests
 *
 * Configuration:
 * - VUs: 3 virtual users running concurrently
 * - Duration: 30 seconds test run
 * - Thresholds: Error rate < 1%, 95th percentile < 800ms
 *
 * @see https://grafana.com/docs/k6/latest/using-k6/thresholds/
 */
import http from 'k6/http';
import { check, sleep } from 'k6';

export const options = {
  vus: 3,           // 3 concurrent users
  duration: '30s',  // Run for 30 seconds
  thresholds: {
    http_req_failed: ['rate<0.01'],      // Error rate < 1%
    http_req_duration: ['p(95)<800'],    // 95% of requests < 800ms
  },
};

export default function () {
  const baseUrl = 'https://test-api.k6.io';
  const response = http.get(baseUrl + '/public/crocodiles/1/');

// Validate response
check(response, {
'status is 200': (res) => res.status === 200,
'body is not empty': (res) => res.body && res.body.length > 0,
});

sleep(1); // Pause between requests
}
What this tests:
- API handles concurrent load
- Response times stay under threshold
- Error rate stays below 1%
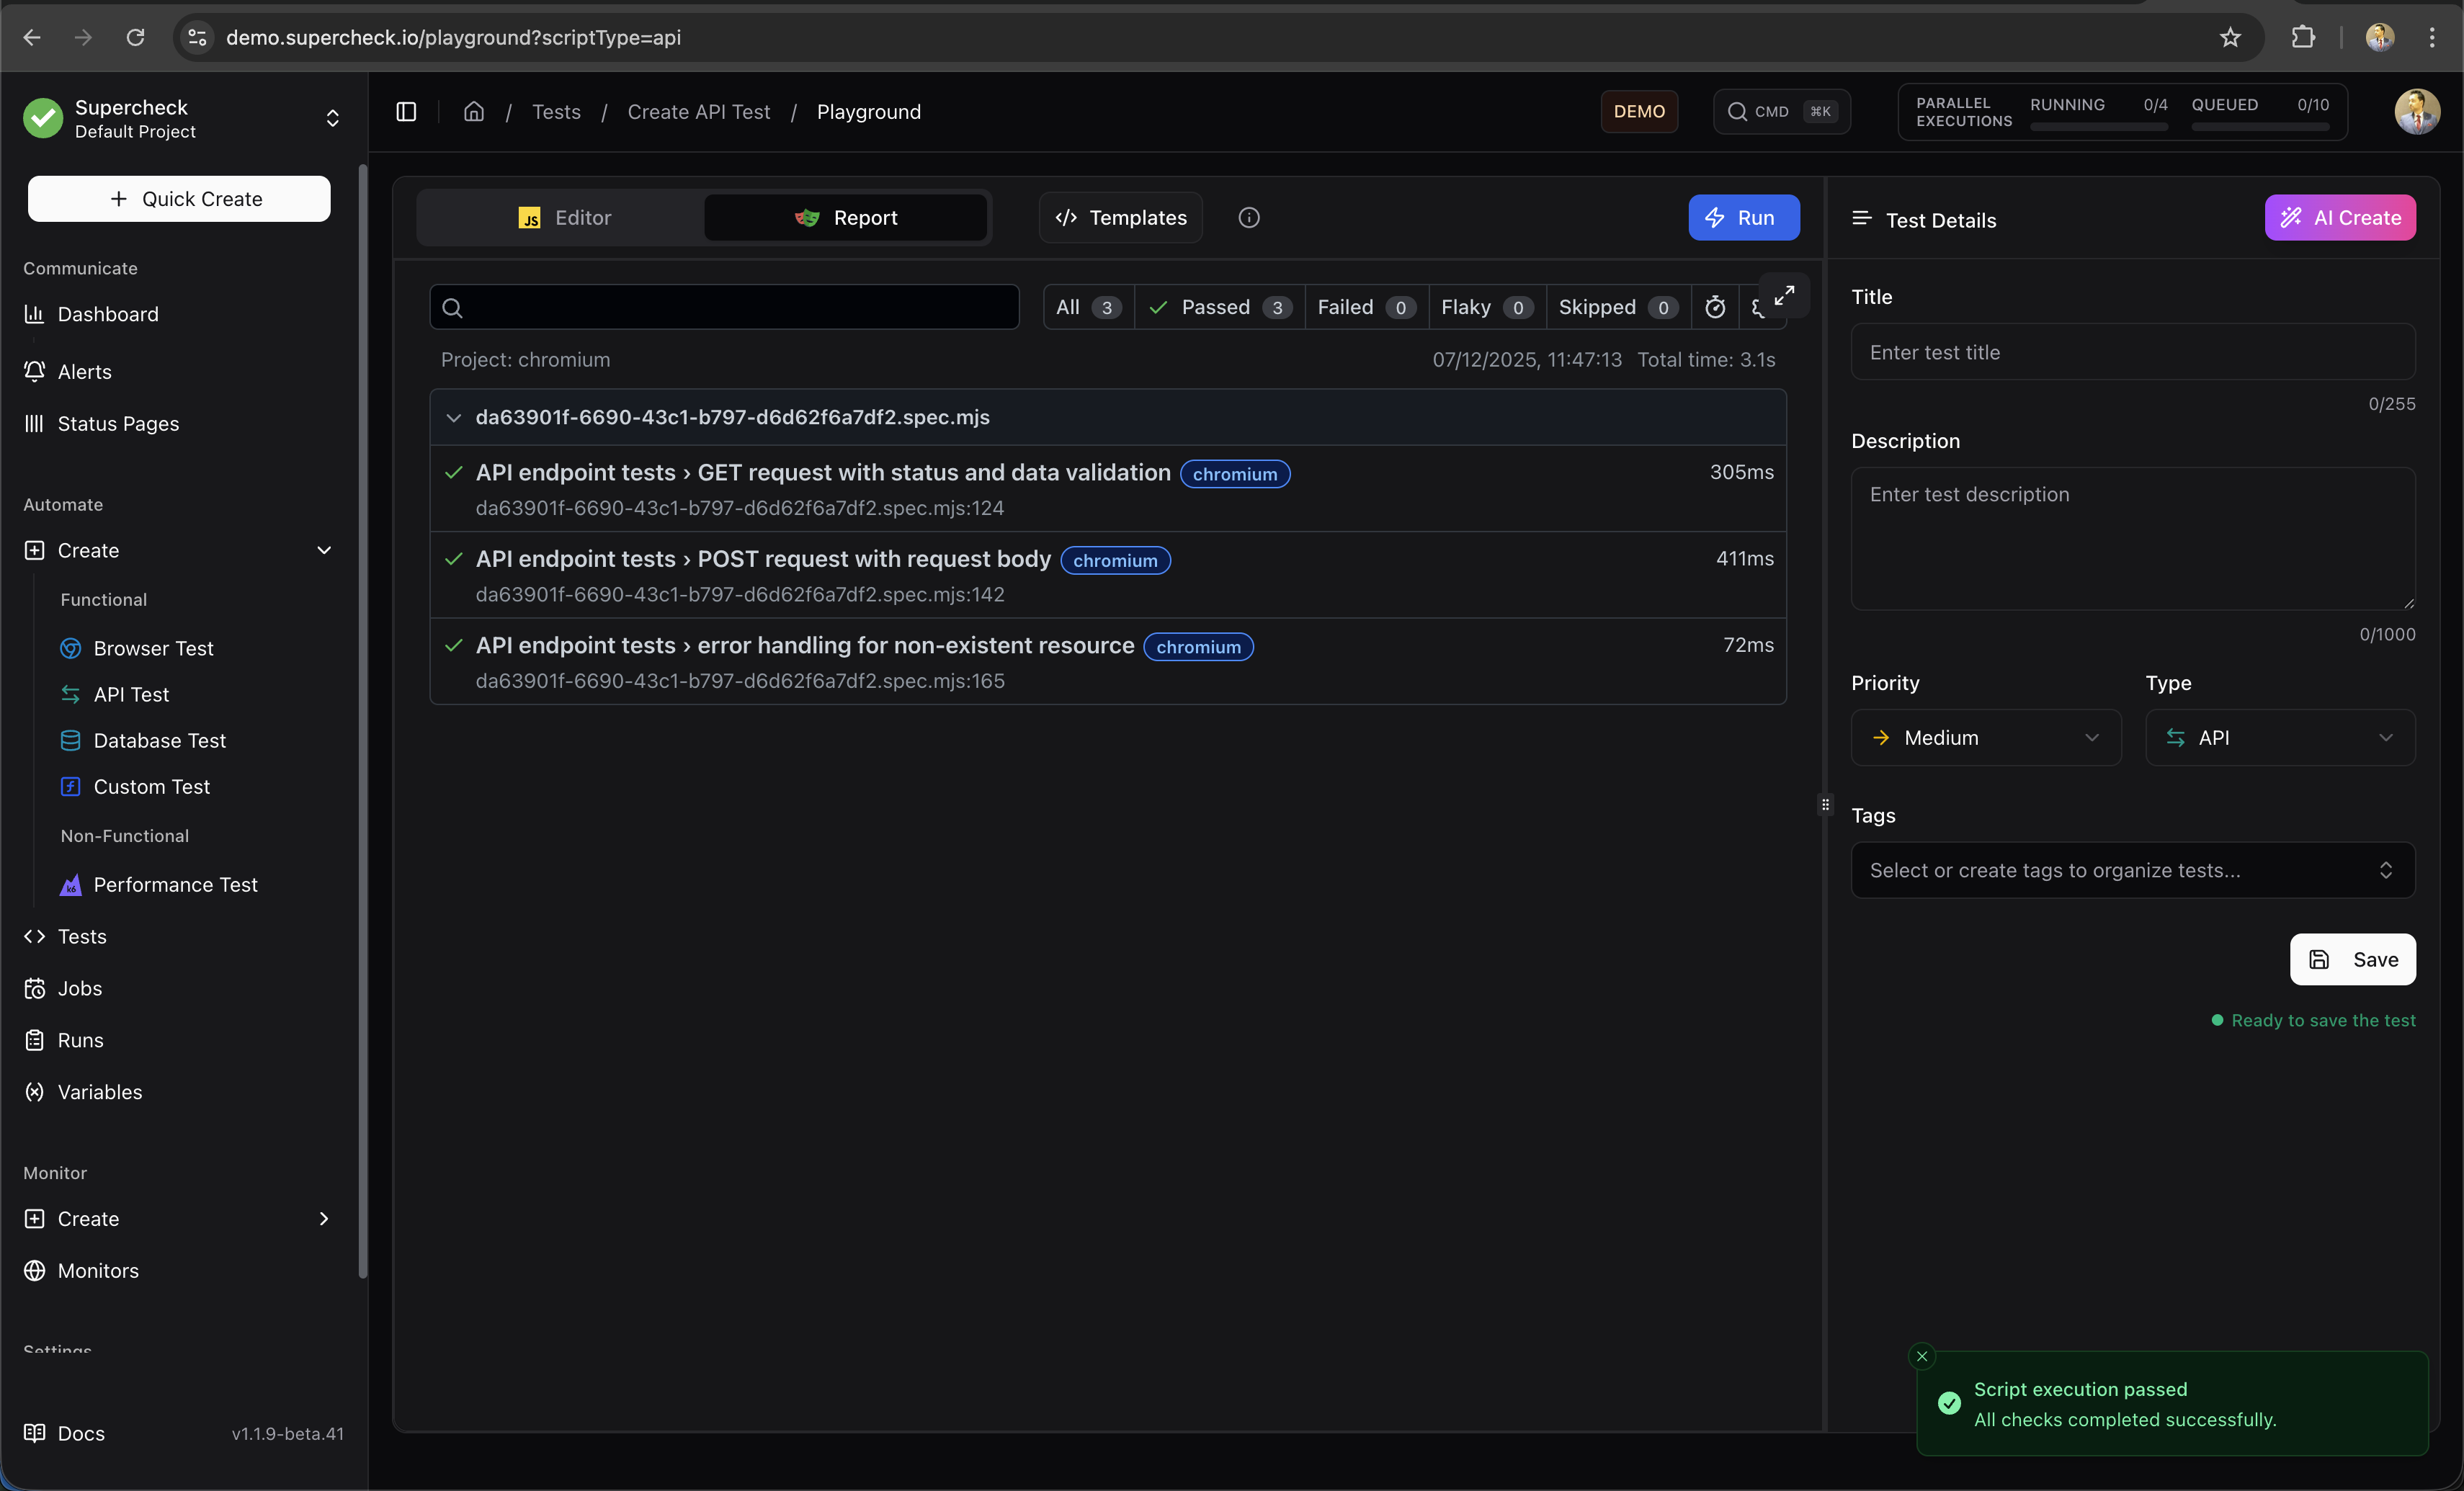
Step 2: Run and Debug
- Click Run to execute your test
- Watch the execution in real-time
- View the report when complete:
- Screenshots — Visual state at each step
- Trace — Step-by-step replay
- Logs — Console output and errors
If Your Test Fails
- Check the screenshot to see what the page looked like
- Use the trace viewer to step through each action
- Click AI Fix to get automatic suggestions for common issues:
- Wrong selectors
- Timing problems
- Assertion mismatches
Step 3: Save Your Test
Only passing tests can be saved. The Save button is disabled until your test executes successfully. If your test fails, fix the issues and run it again.
Once your test passes:
- Click Save in the Playground
- Enter a descriptive name (e.g., "Homepage Load Test")
- Select the project to save to
- Click Save
Your test is now stored and can be added to jobs or monitors.
Step 4: Create a Scheduled Job
Jobs run your tests automatically on a schedule.
- Go to Create → Job
- Enter a name (e.g., "Nightly Regression")
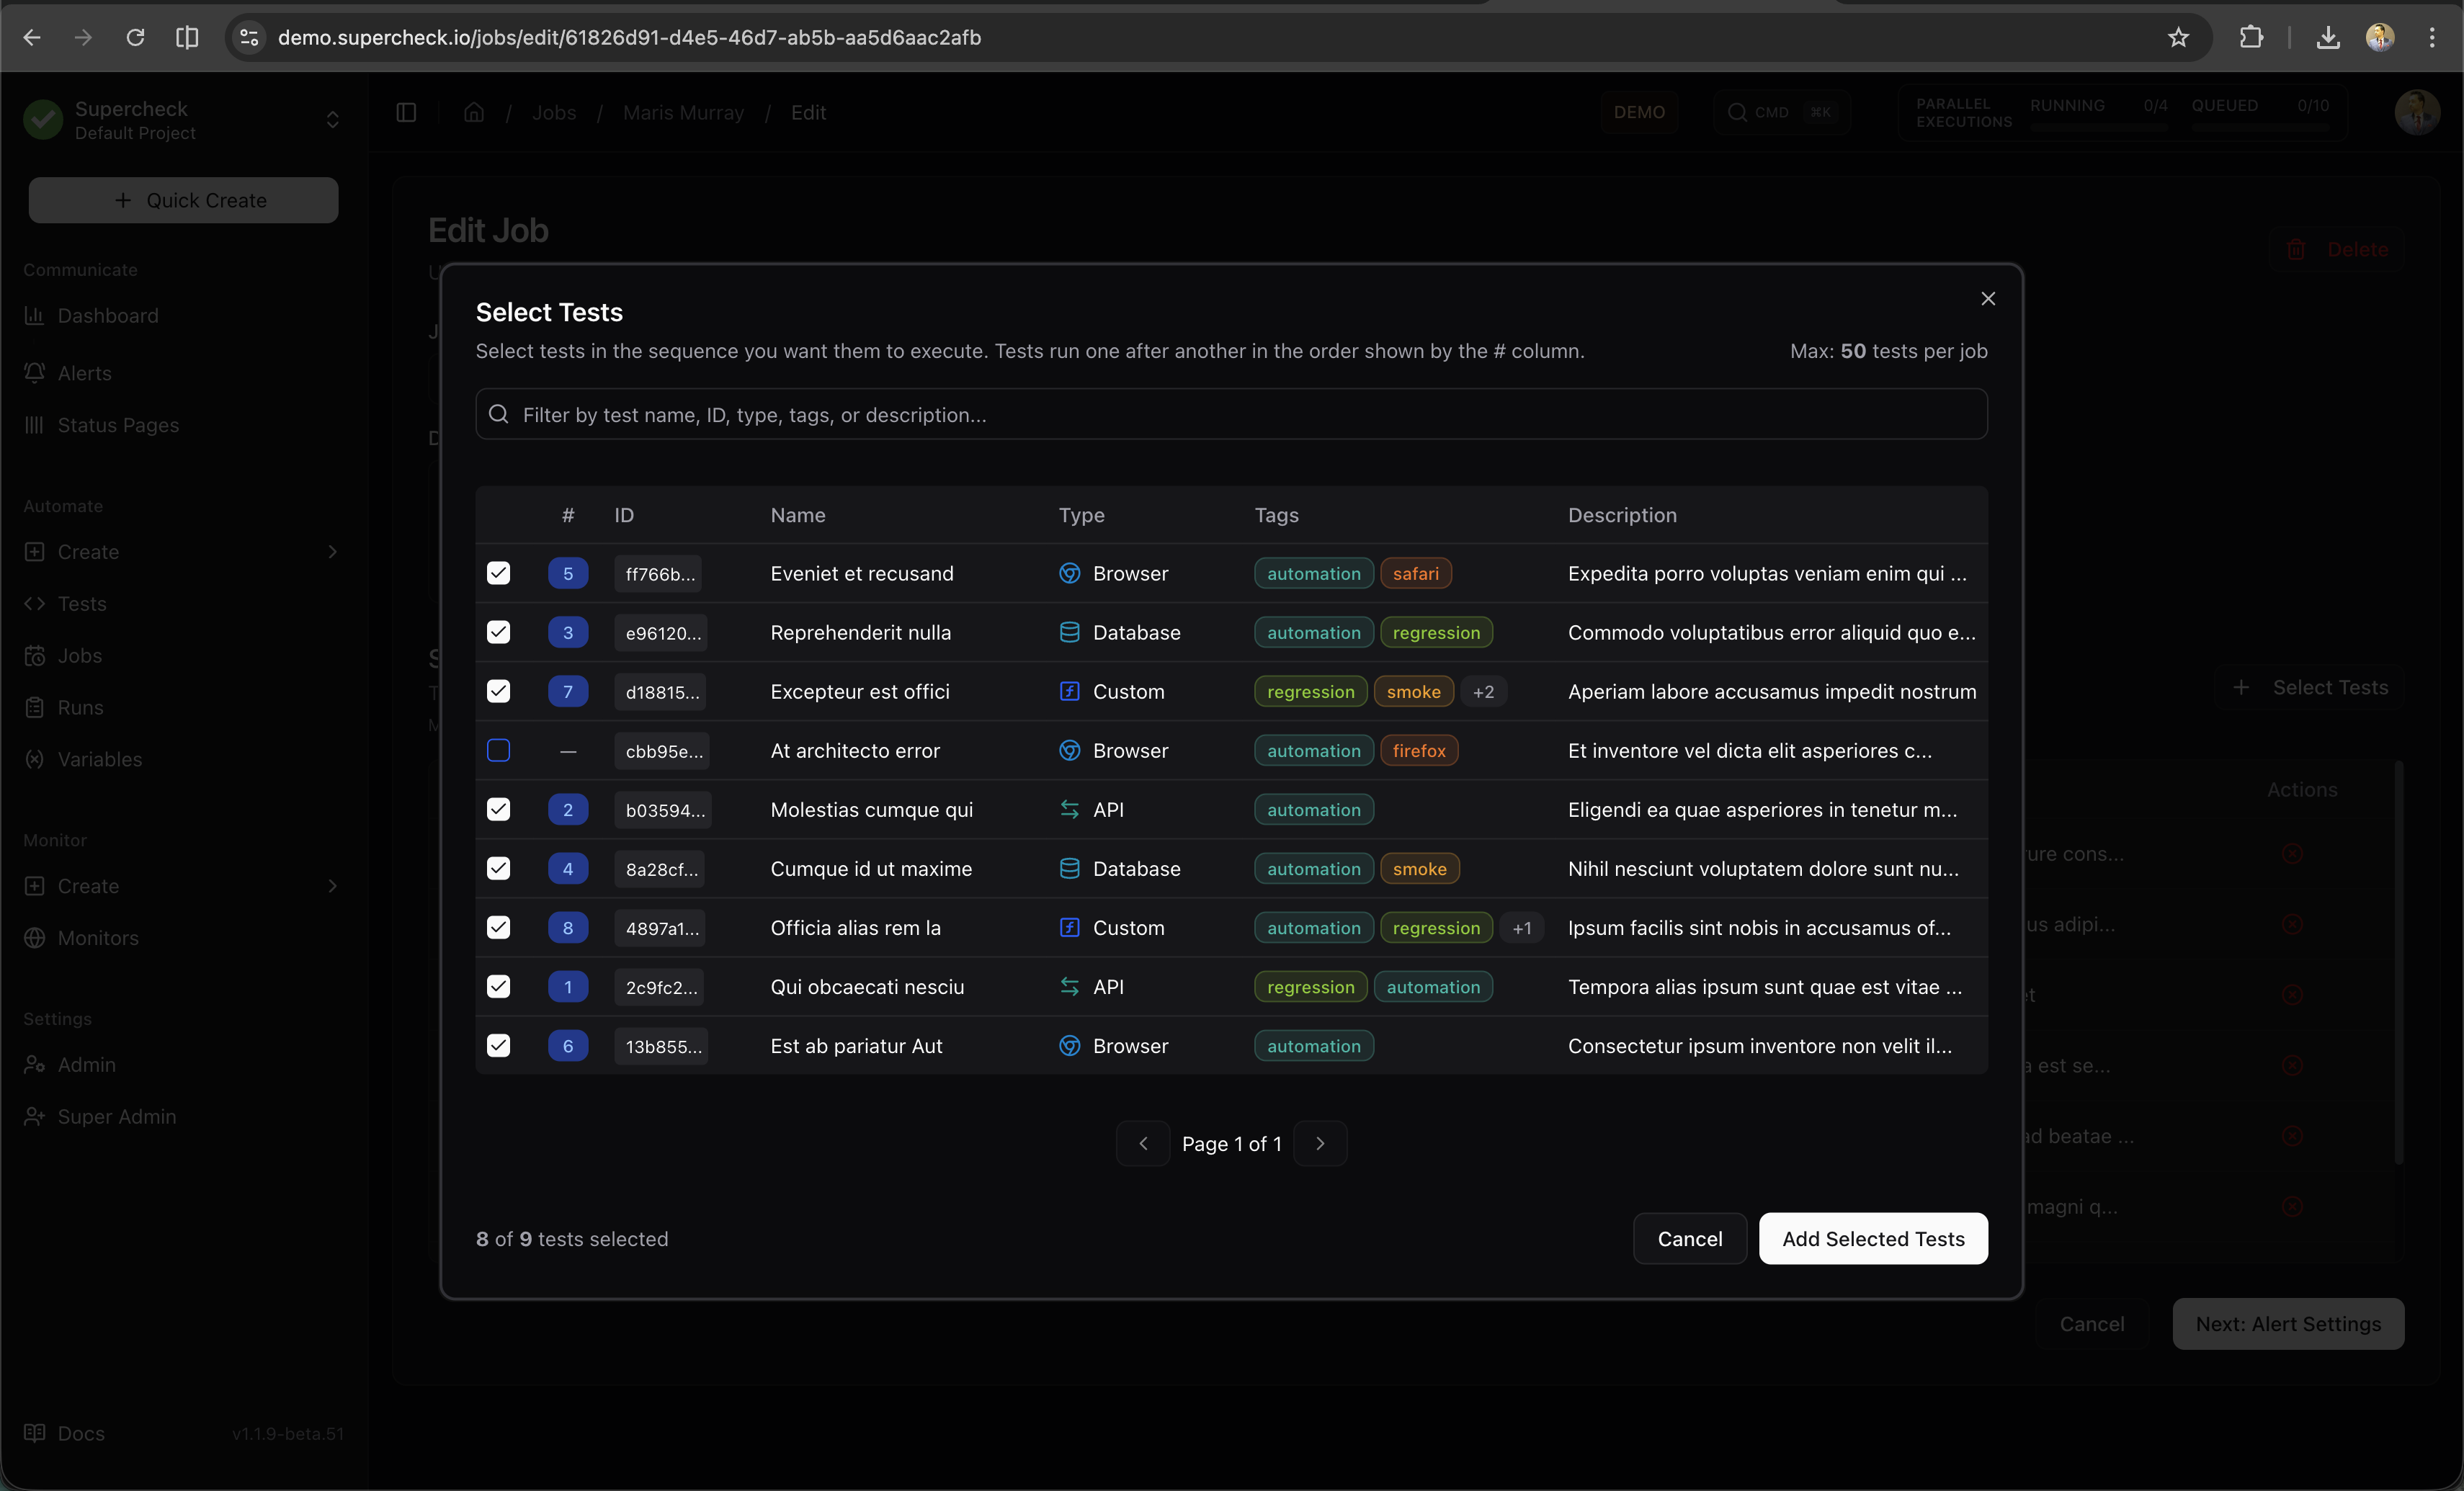
- Select the tests to include
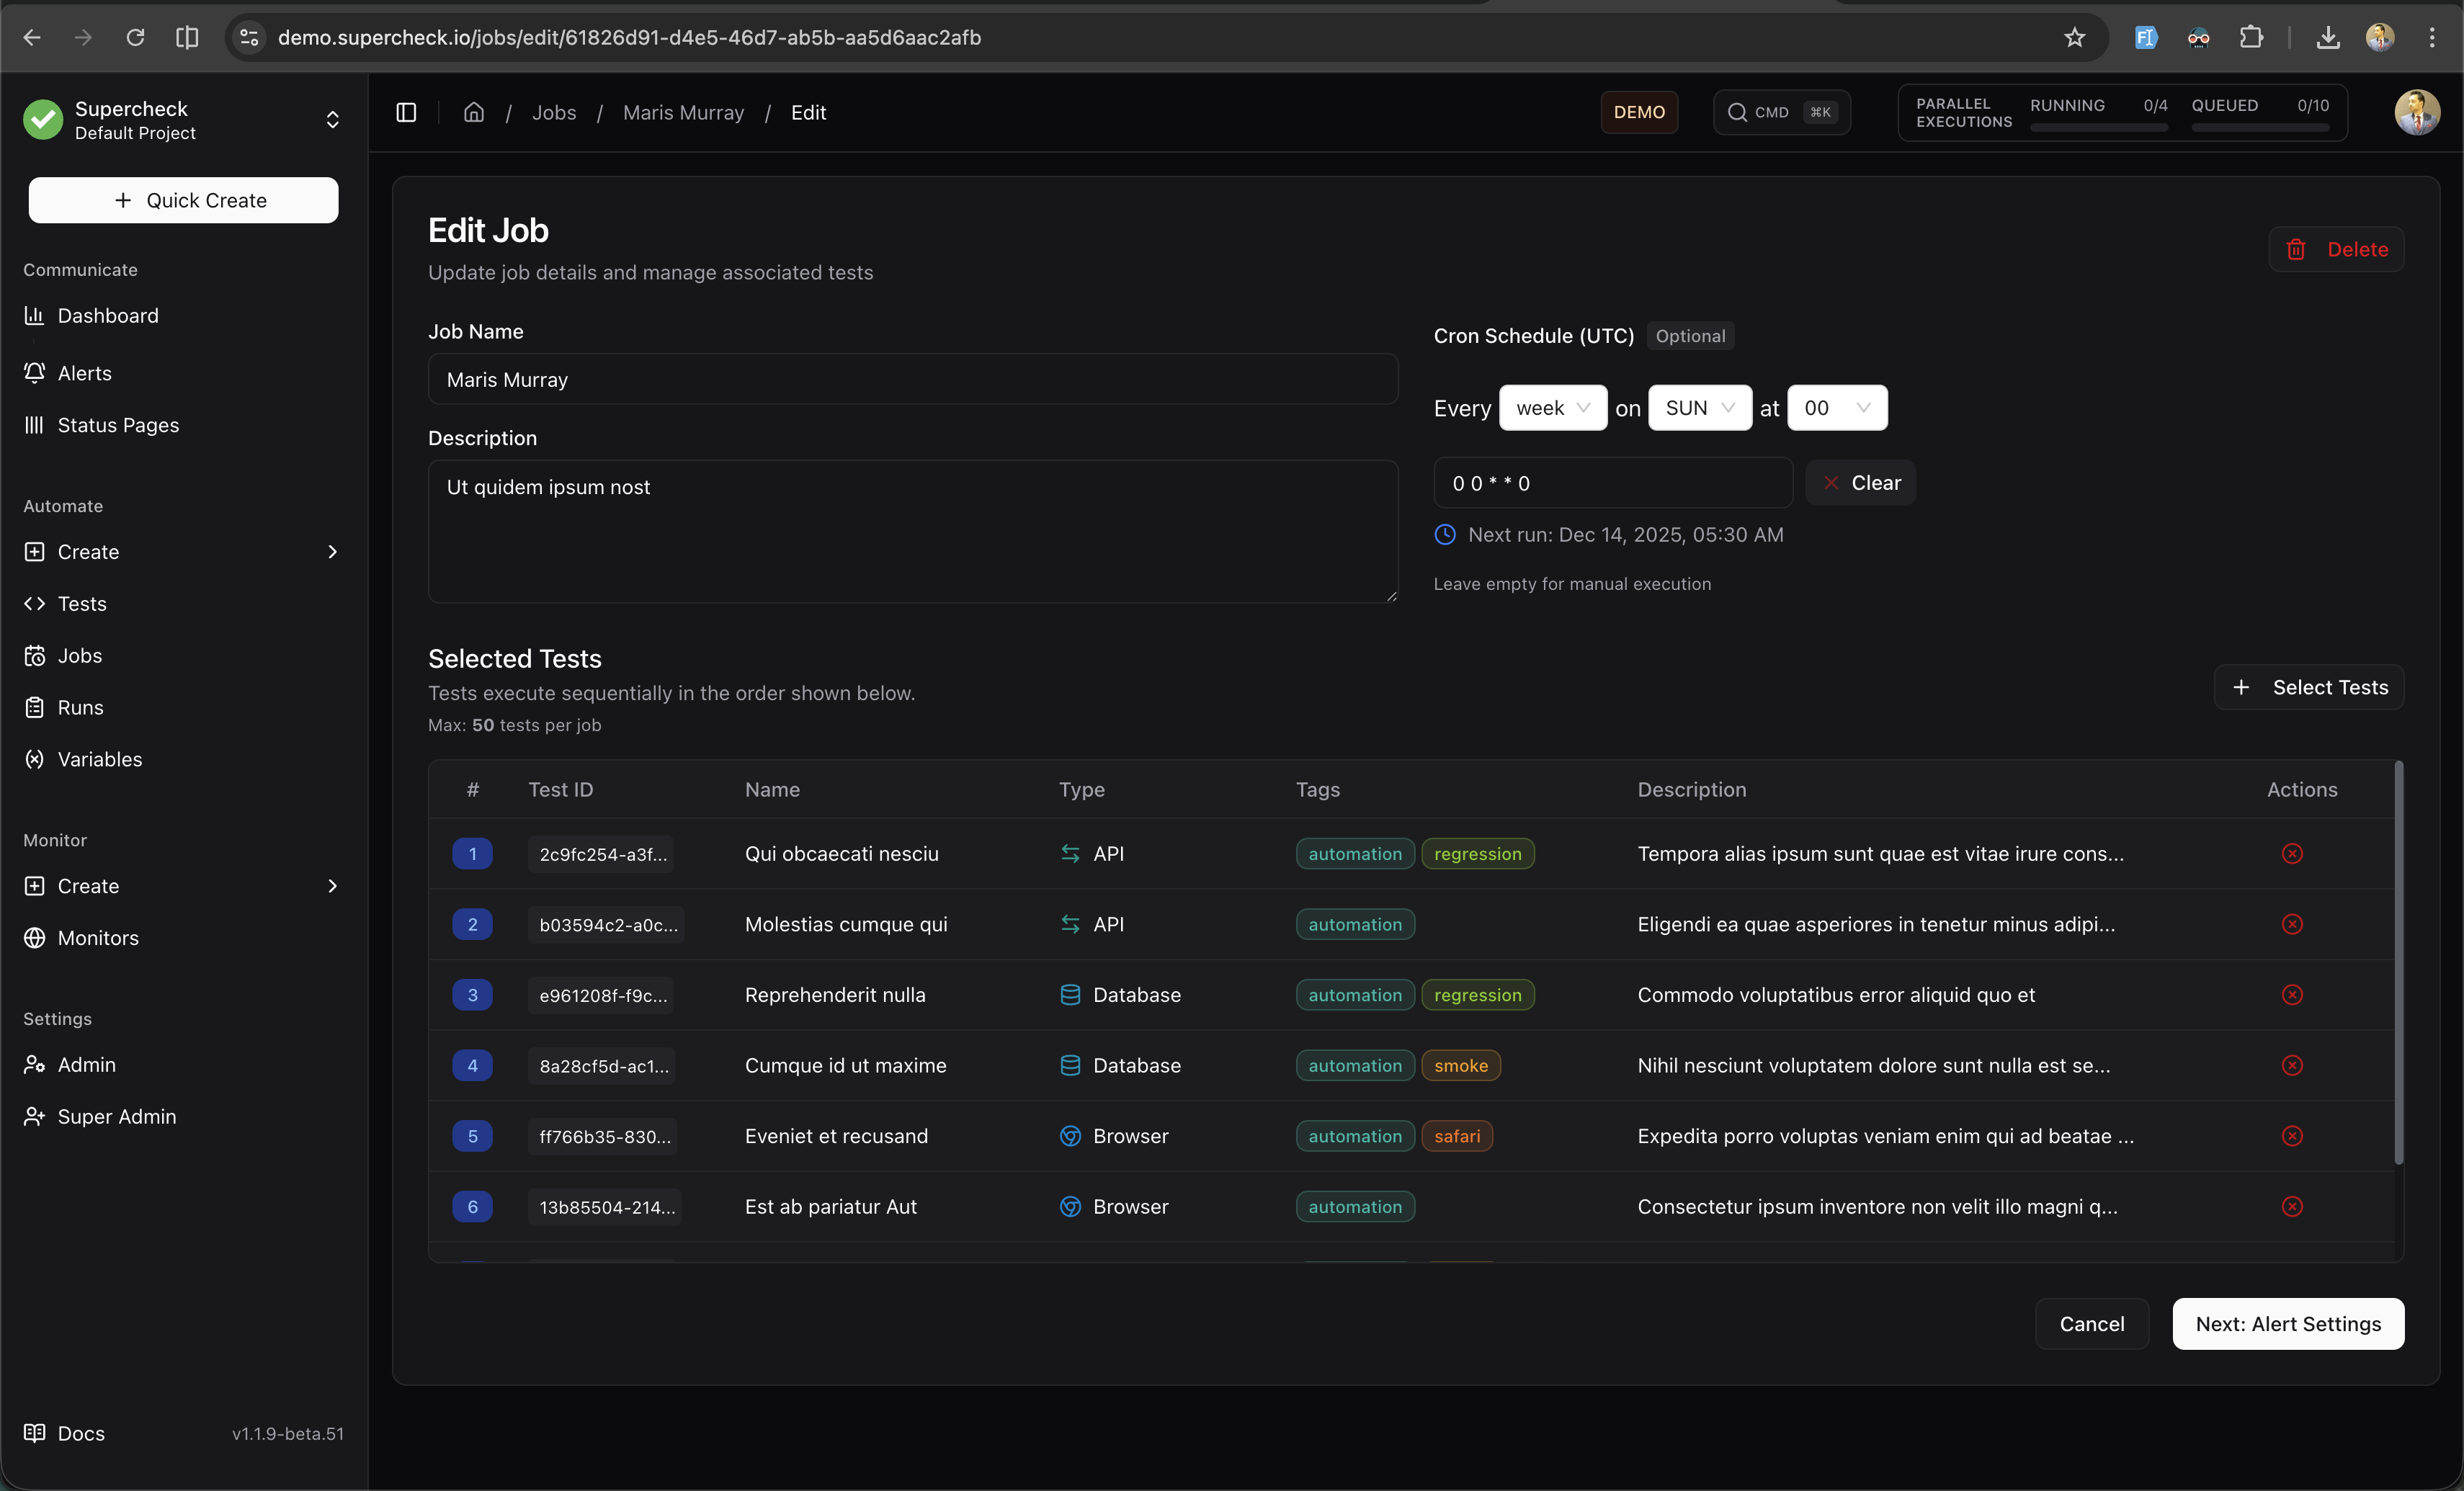
- Configure the schedule from the dropdown.
- Click Save
Step 5: Set Up Alerts
Get notified when tests fail.
Add a Notification Provider
- Go to Alerts → Notification Channels
- Click Add Provider
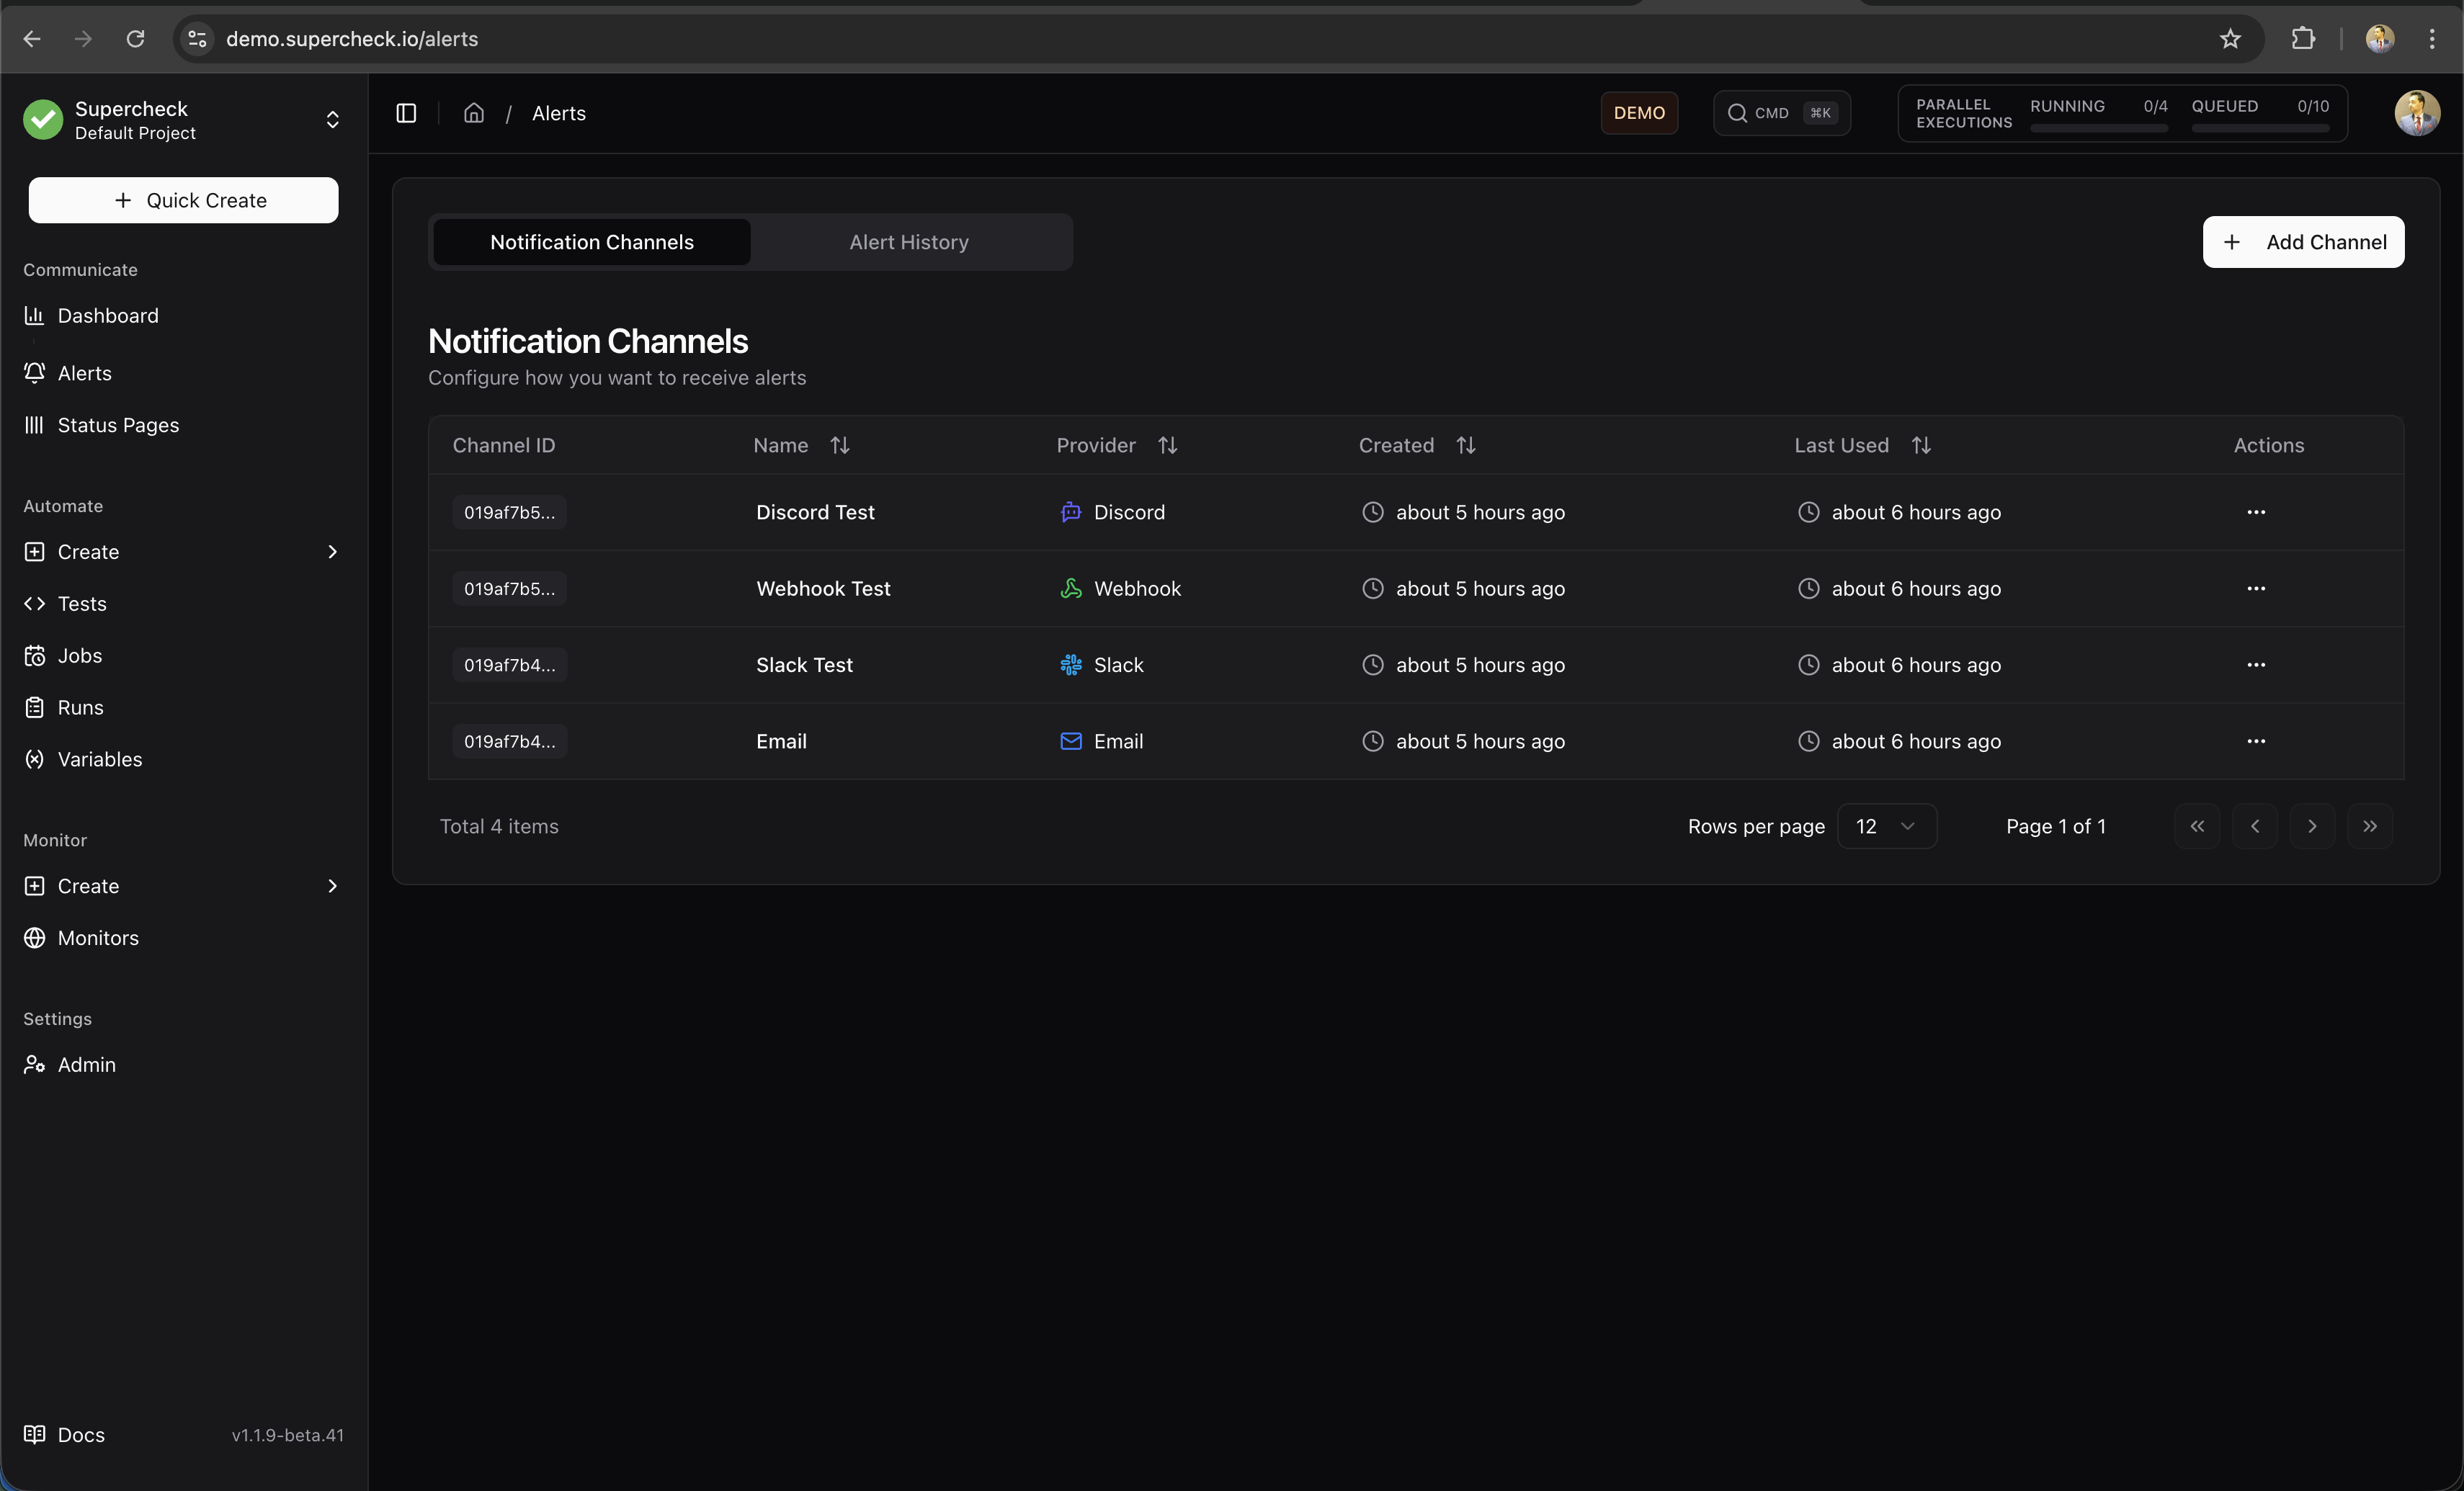
- Choose your preferred channel:
| Provider | Setup |
|---|---|
| Slack | Paste your webhook URL |
| Configure SMTP settings | |
| Discord | Paste your webhook URL |
| Telegram | Enter bot token and chat ID |
| Webhook | Enter your endpoint URL |
- Click Test to verify
- Click Save
Attach Alerts to Your Job
- Edit your job
- Go to the Alerts section
- Select your notification provider
- Enable Alert on Failure
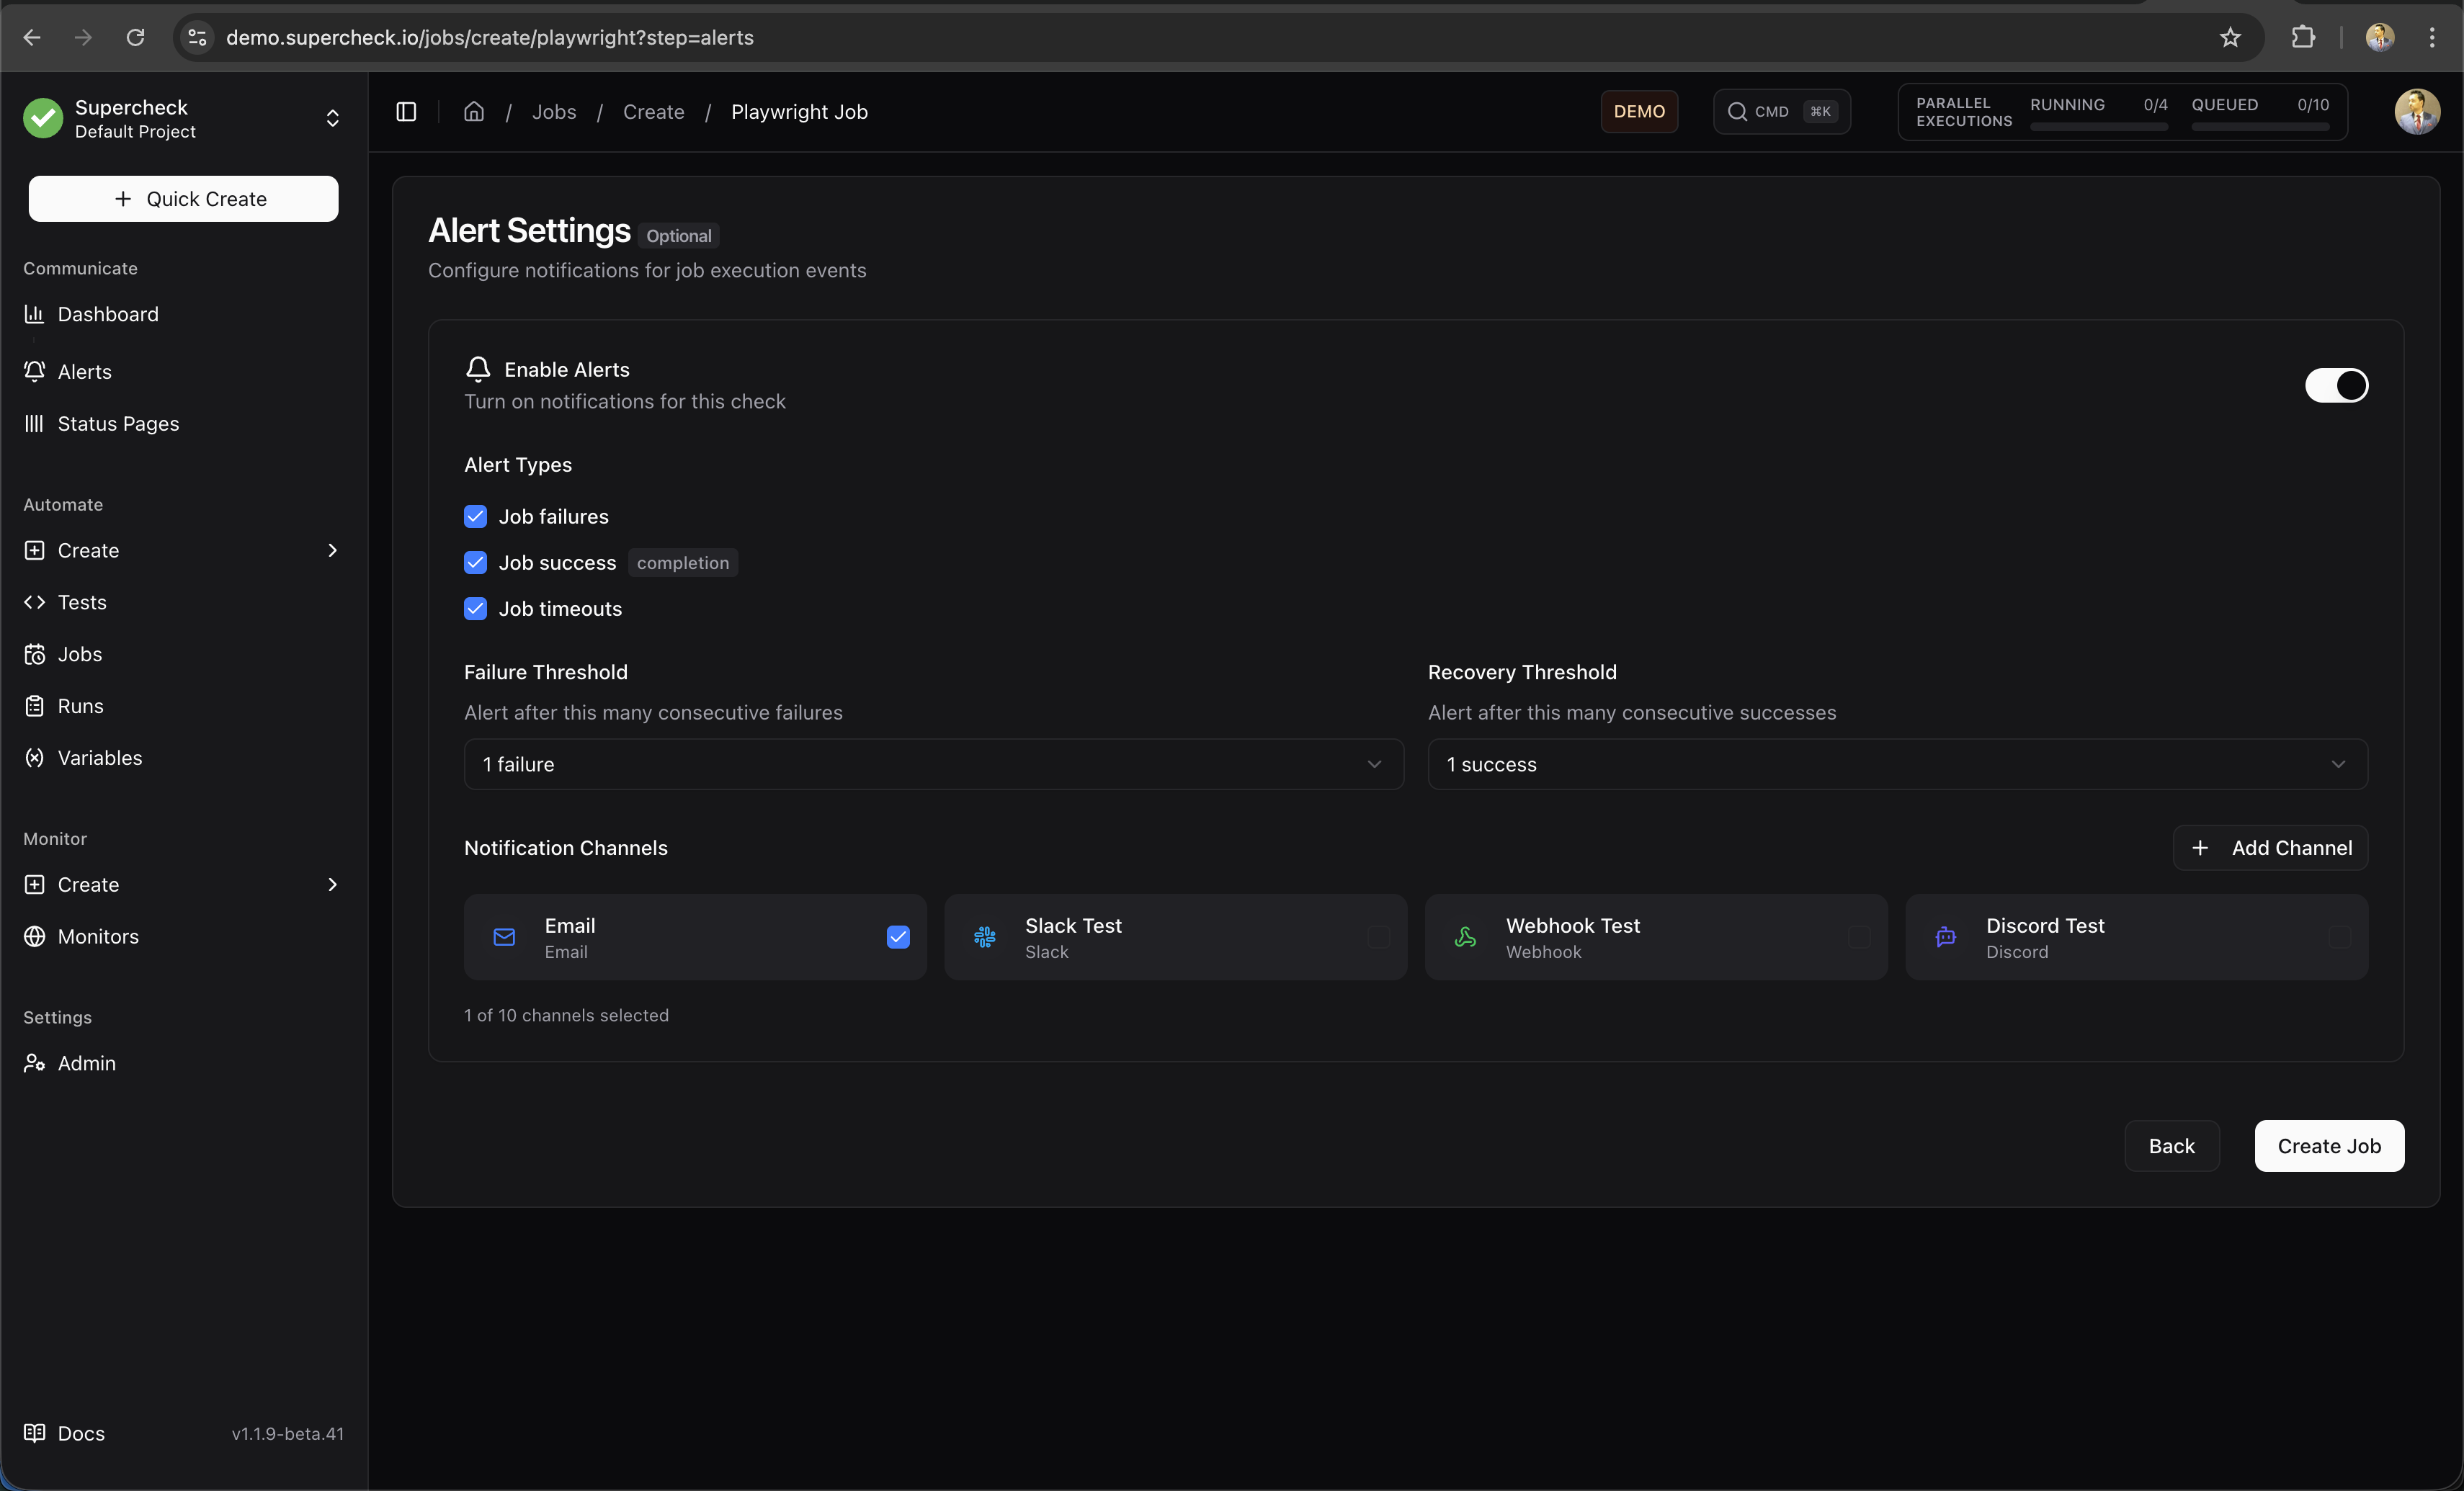
- Save
Step 6: Create a Monitor (Optional)
Monitors check your services continuously, independent of your test suite.
- Go to Create → Monitor
- Choose monitor type:
- HTTP — For APIs and endpoints
- Website — For web pages with SSL tracking
- Ping — For server availability
- Port — For service connectivity
- Synthetic — For full Playwright tests
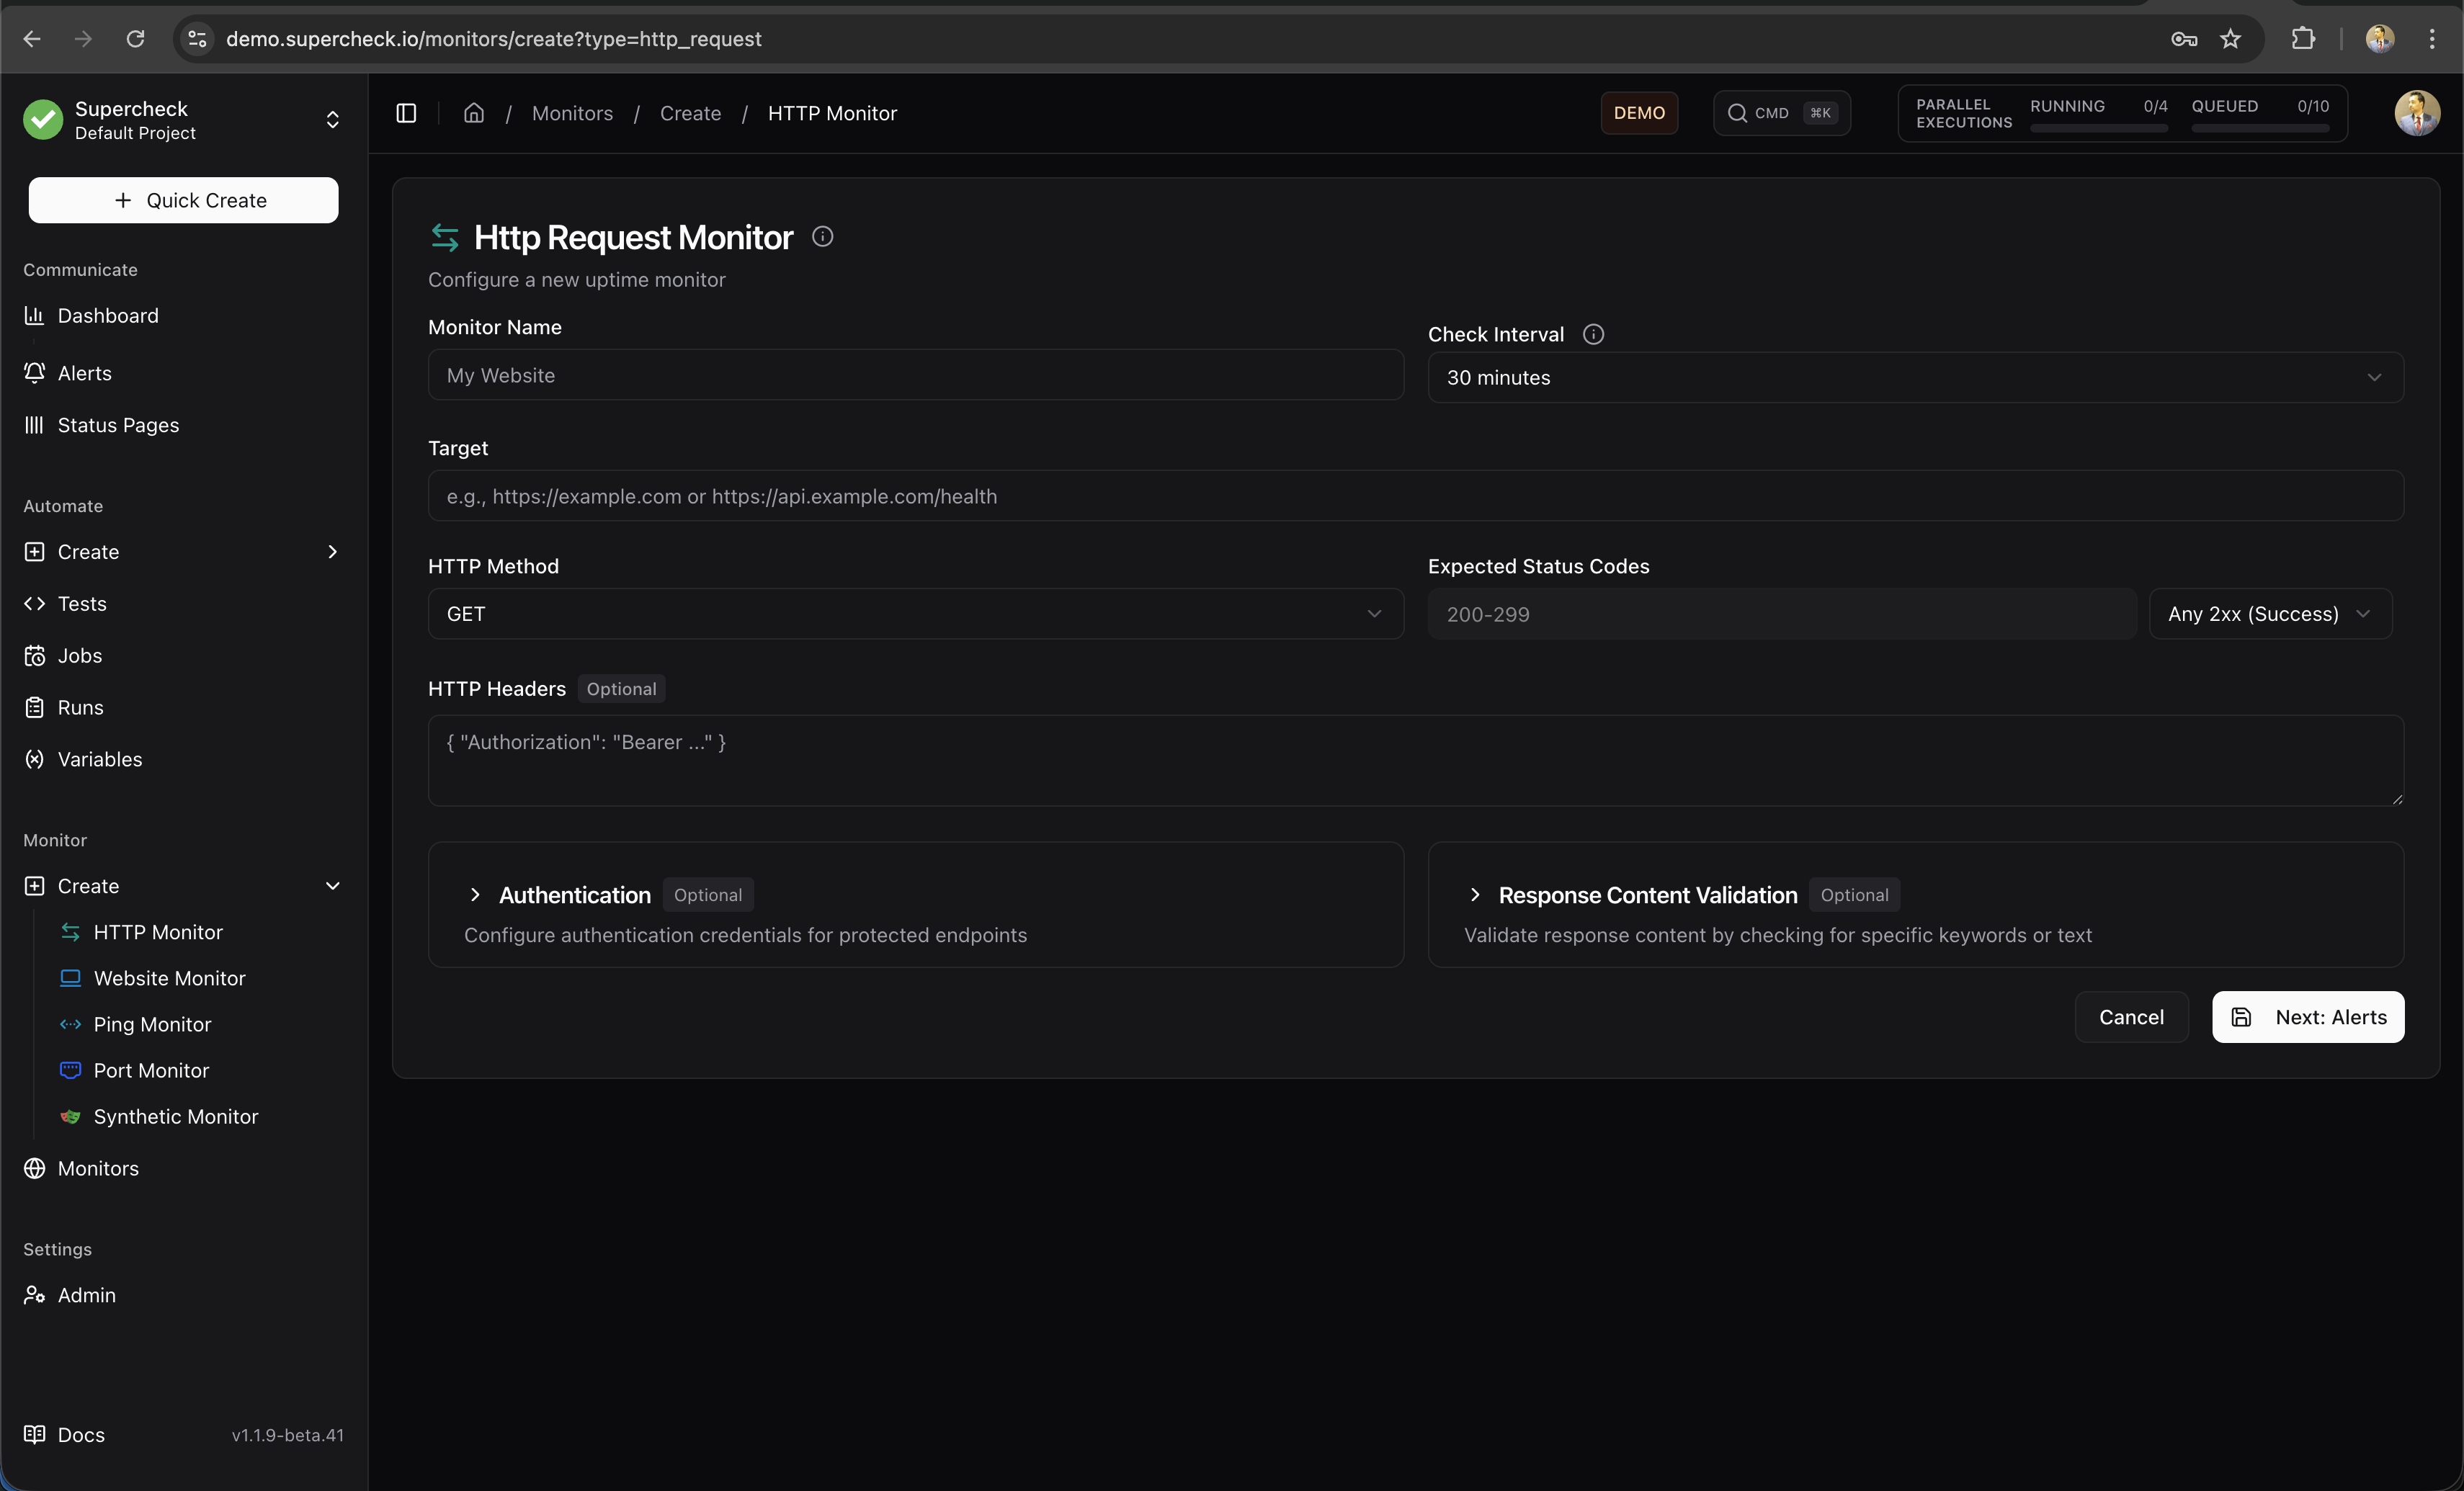
- Enter the target URL
- Set check interval (e.g., 5 minutes)
- Configure alert thresholds
- Select notification providers
- Click Save
The monitor starts checking immediately.
What You've Built
After completing this guide, you have:
- ✅ A test that validates your application
- ✅ A scheduled job that runs tests automatically
- ✅ Alerts that notify you of failures
- ✅ A monitor (optional) for continuous uptime tracking
Next Steps
Playground
Learn more about AI Create, AI Fix, and the test editor
Monitors
Set up comprehensive uptime monitoring
Variables
Store API keys and secrets securely
Status Pages
Create public status pages for your users
Common Questions
How do I test with authentication?
Use Variables to store credentials:
/**
 * Login test using secure credentials from project variables.
 * Secrets require .toString() to access the actual value.
 */
const email = getVariable('TEST_USER_EMAIL');
const password = getSecret('TEST_PASSWORD').toString();

await page.fill('#email', email);
await page.fill('#password', password);
await page.click('button[type="submit"]');
How do I run tests from CI/CD?
Generate an API key in your job's CI/CD tab, then trigger via HTTP:
curl -X POST https://your-instance.com/api/jobs/{jobId}/trigger \
  -H "Authorization: Bearer YOUR_API_KEY"
How do I test from different regions?
Self-Hosted Deployments: All tests and monitors execute from your local infrastructure. The multi-region selector is available for configuration consistency, but execution occurs sequentially from your single worker location.
Cloud Deployments:
- Performance Tests:
- Playground: Select specific location (US East, EU Central, or Asia Pacific) for manual test runs
- Jobs: Use global queue—tests execute from any available worker regardless of location
- Monitors: Run simultaneously from US East, EU Central, and Asia Pacific using region-specific queues for true geographic distribution