Dashboard
Project overview, real-time metrics, and performance analyticsEdit
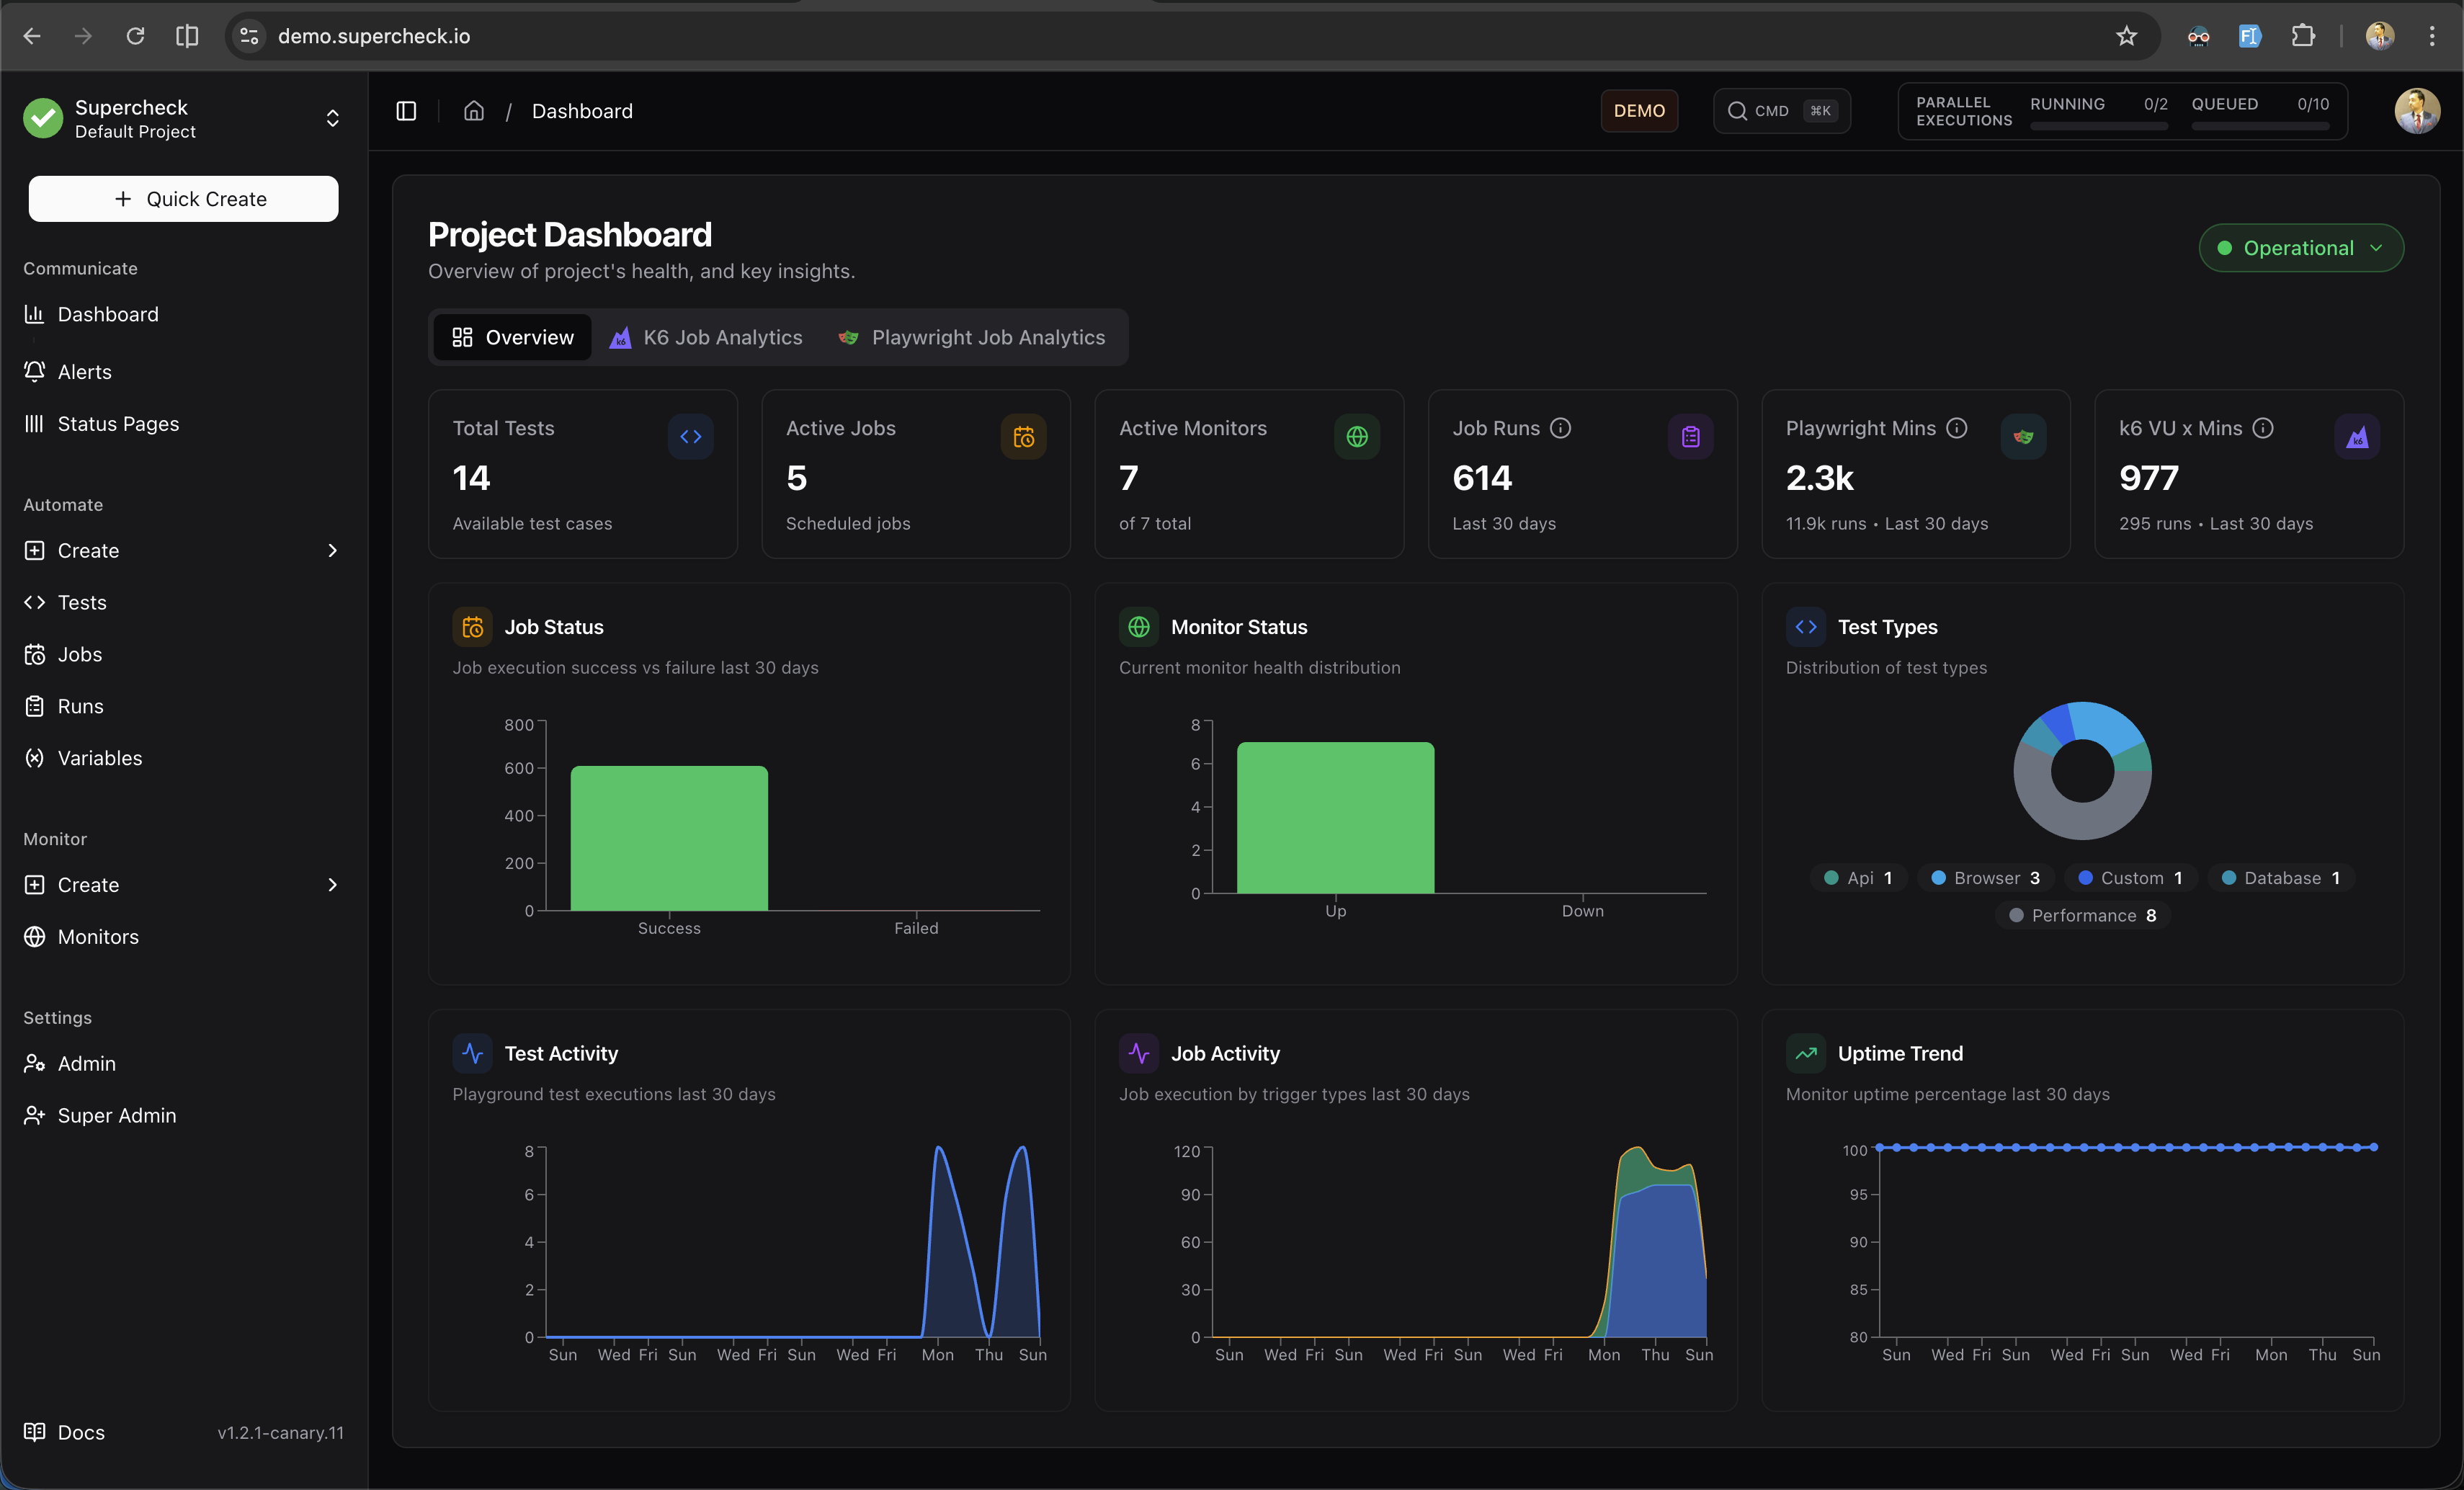
The Dashboard provides a comprehensive view of your project's health with real-time insights into tests, jobs, monitors, and detailed analytics for both Playwright and K6 performance tests.
The Dashboard provides a comprehensive view of your project's health with real-time insights into tests, jobs, monitors, and detailed analytics for both Playwright and K6 performance tests.
The Overview tab shows key project metrics at a glance.
Key Metrics
| Metric | Description |
|---|---|
| Total Tests | Test cases saved in your project |
| Active Jobs | Scheduled or running jobs |
| Active Monitors | Enabled monitoring endpoints |
| Total Runs | Job executions (last 30 days) |
| Execution Time | Total test time (last 30 days) |
Charts
Job Runs
Bar chart showing successful vs failed job runs over the last 30 days. Quickly identify failure patterns and trends.
Monitor Status
Current health distribution of all monitors:
- Up — Monitors passing health checks
- Down — Monitors failing health checks
Test Types
Pie chart breakdown of test types in your project:
- Browser, API, Database, Custom, Performance
Job Activity
Stacked area chart showing job triggers by type:
- Manual — User-initiated runs
- Scheduled — Cron-based runs
- Remote — API-triggered runs (CI/CD)
Uptime Trend
Line chart showing monitor uptime percentage over 30 days. Track reliability trends over time.
The K6 Analytics tab provides detailed performance metrics for your load tests.
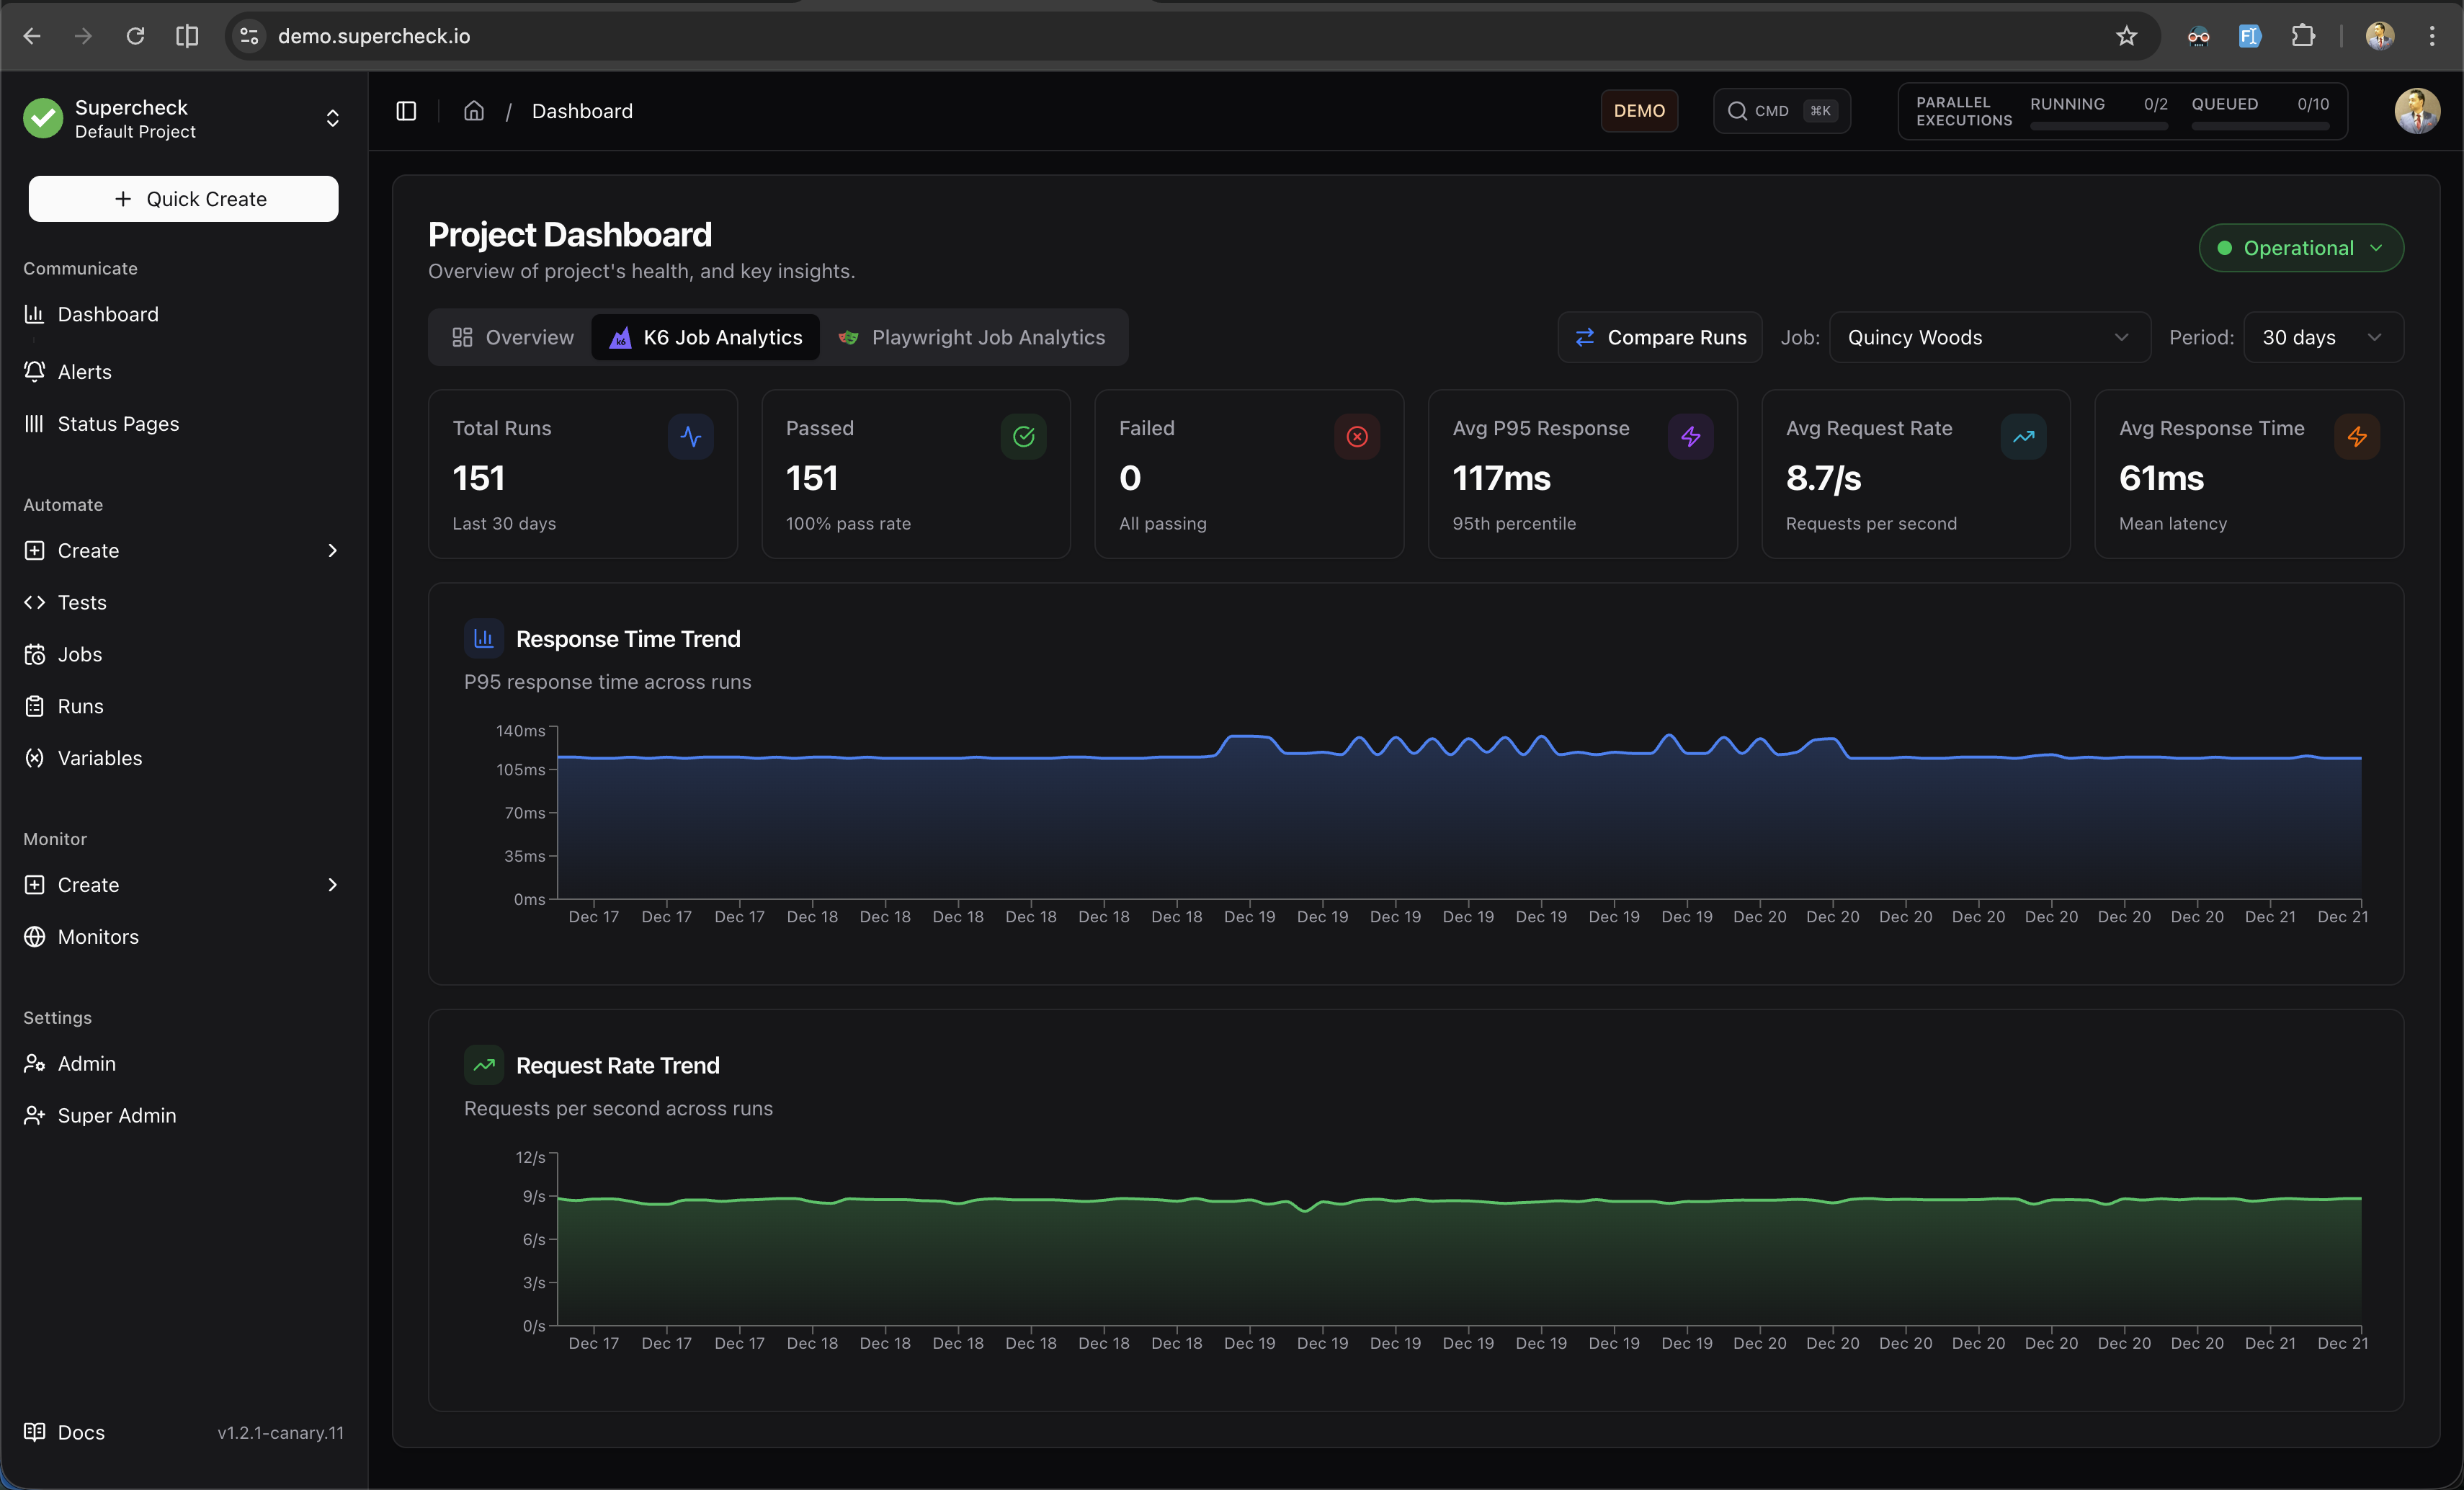
Filters
- Job — Filter to a specific K6 job or view all jobs
- Period — Analyze last 30, 60, or 90 days of data
Metric Cards
| Metric | Description |
|---|---|
| Total Runs | Number of K6 test executions in the selected period |
| Passed | Runs where all thresholds passed, with pass rate percentage |
| Failed | Runs with threshold failures (highlighted if attention needed) |
| Avg P95 Response | Average 95th percentile response time across runs |
| Avg Request Rate | Average requests per second across runs |
| Avg Response Time | Mean response latency across runs |
Charts
Response Time Trend
Area chart showing P95 response time across runs. Use this to identify performance regressions or improvements over time.
Request Rate Trend
Area chart showing requests per second across runs. Monitor throughput patterns and capacity trends.
Run Comparison
When a specific job is selected and has 2+ runs, click Compare Runs to open a side-by-side comparison dialog.
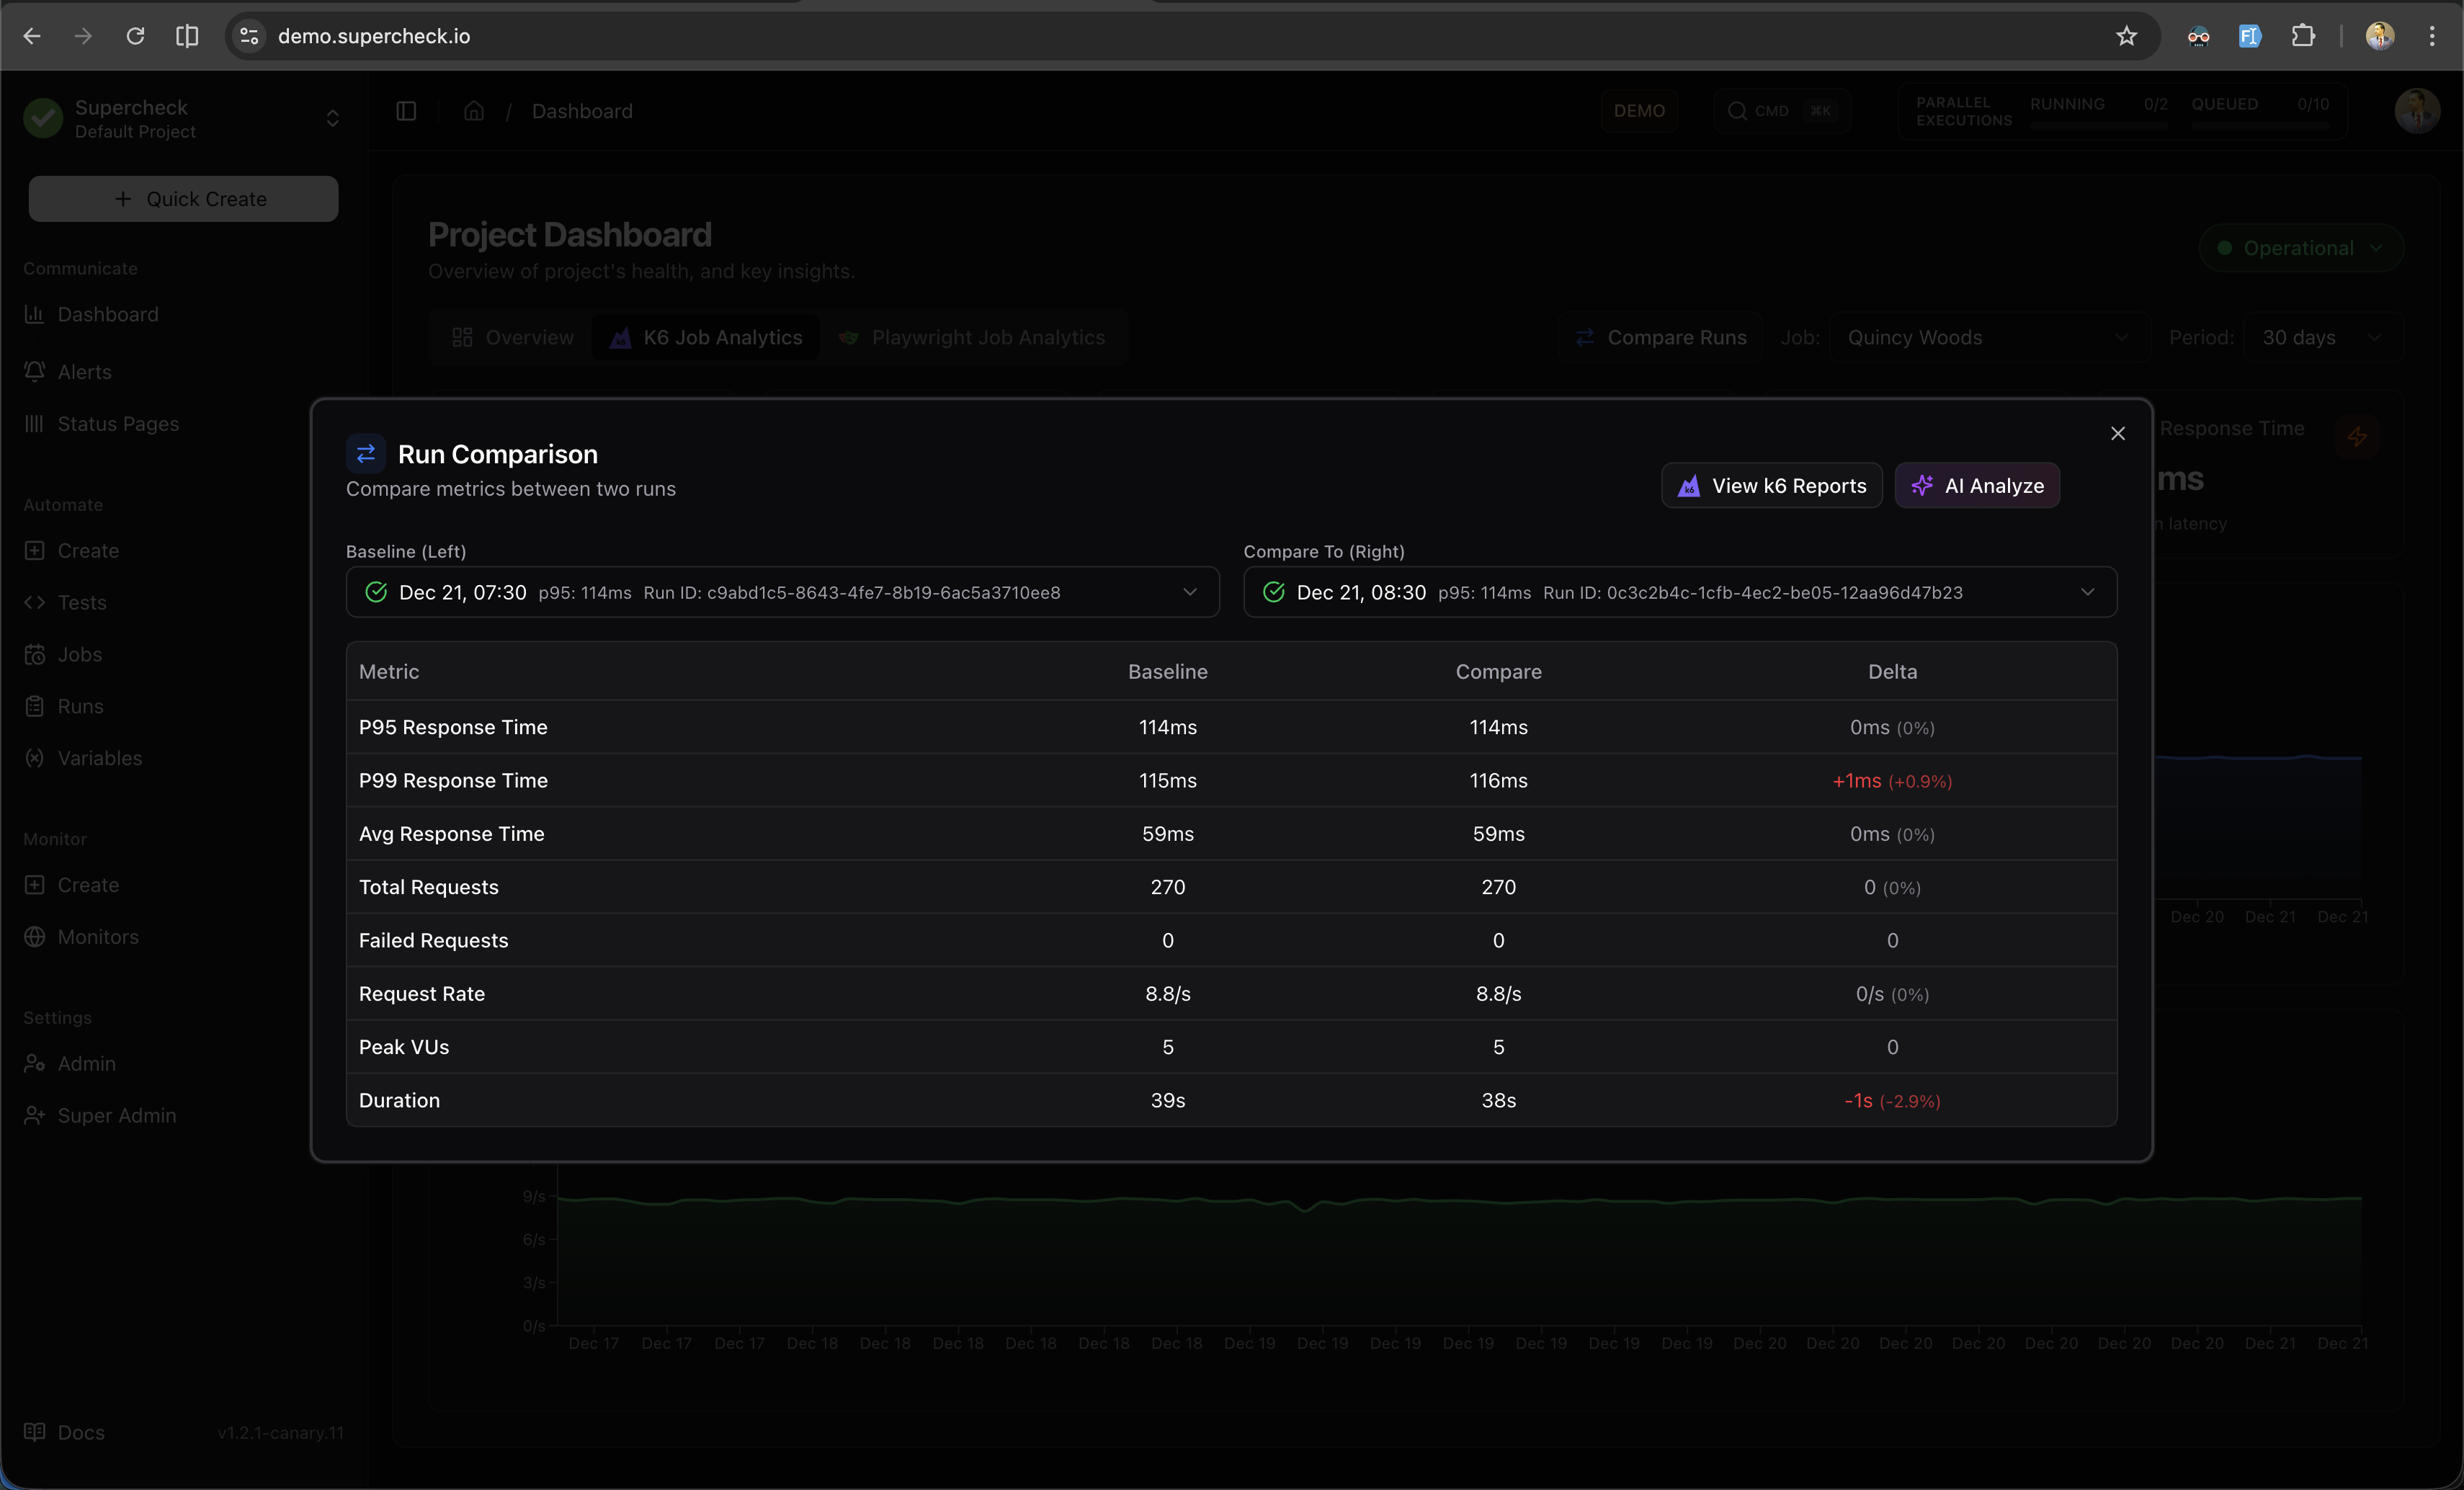
Run Selection
- Baseline (Left) — Select the reference run to compare against
- Compare To (Right) — Select the run to compare with the baseline
Each run in the dropdown displays:
- Pass/fail status indicator
- Run date and time
- P95 response time
- Run ID
Comparison Metrics
The comparison table shows metrics from both runs with calculated delta values:
| Metric | Description | Better When |
|---|---|---|
| P95 / P99 / Avg Response | Latency percentiles | Lower |
| Total / Failed Requests | Request counts | Higher / Lower |
| Request Rate | Requests per second | Higher |
| Peak VUs | Maximum virtual users | Context-dependent |
Delta values are color-coded:
- Green — Improvement
- Red — Regression
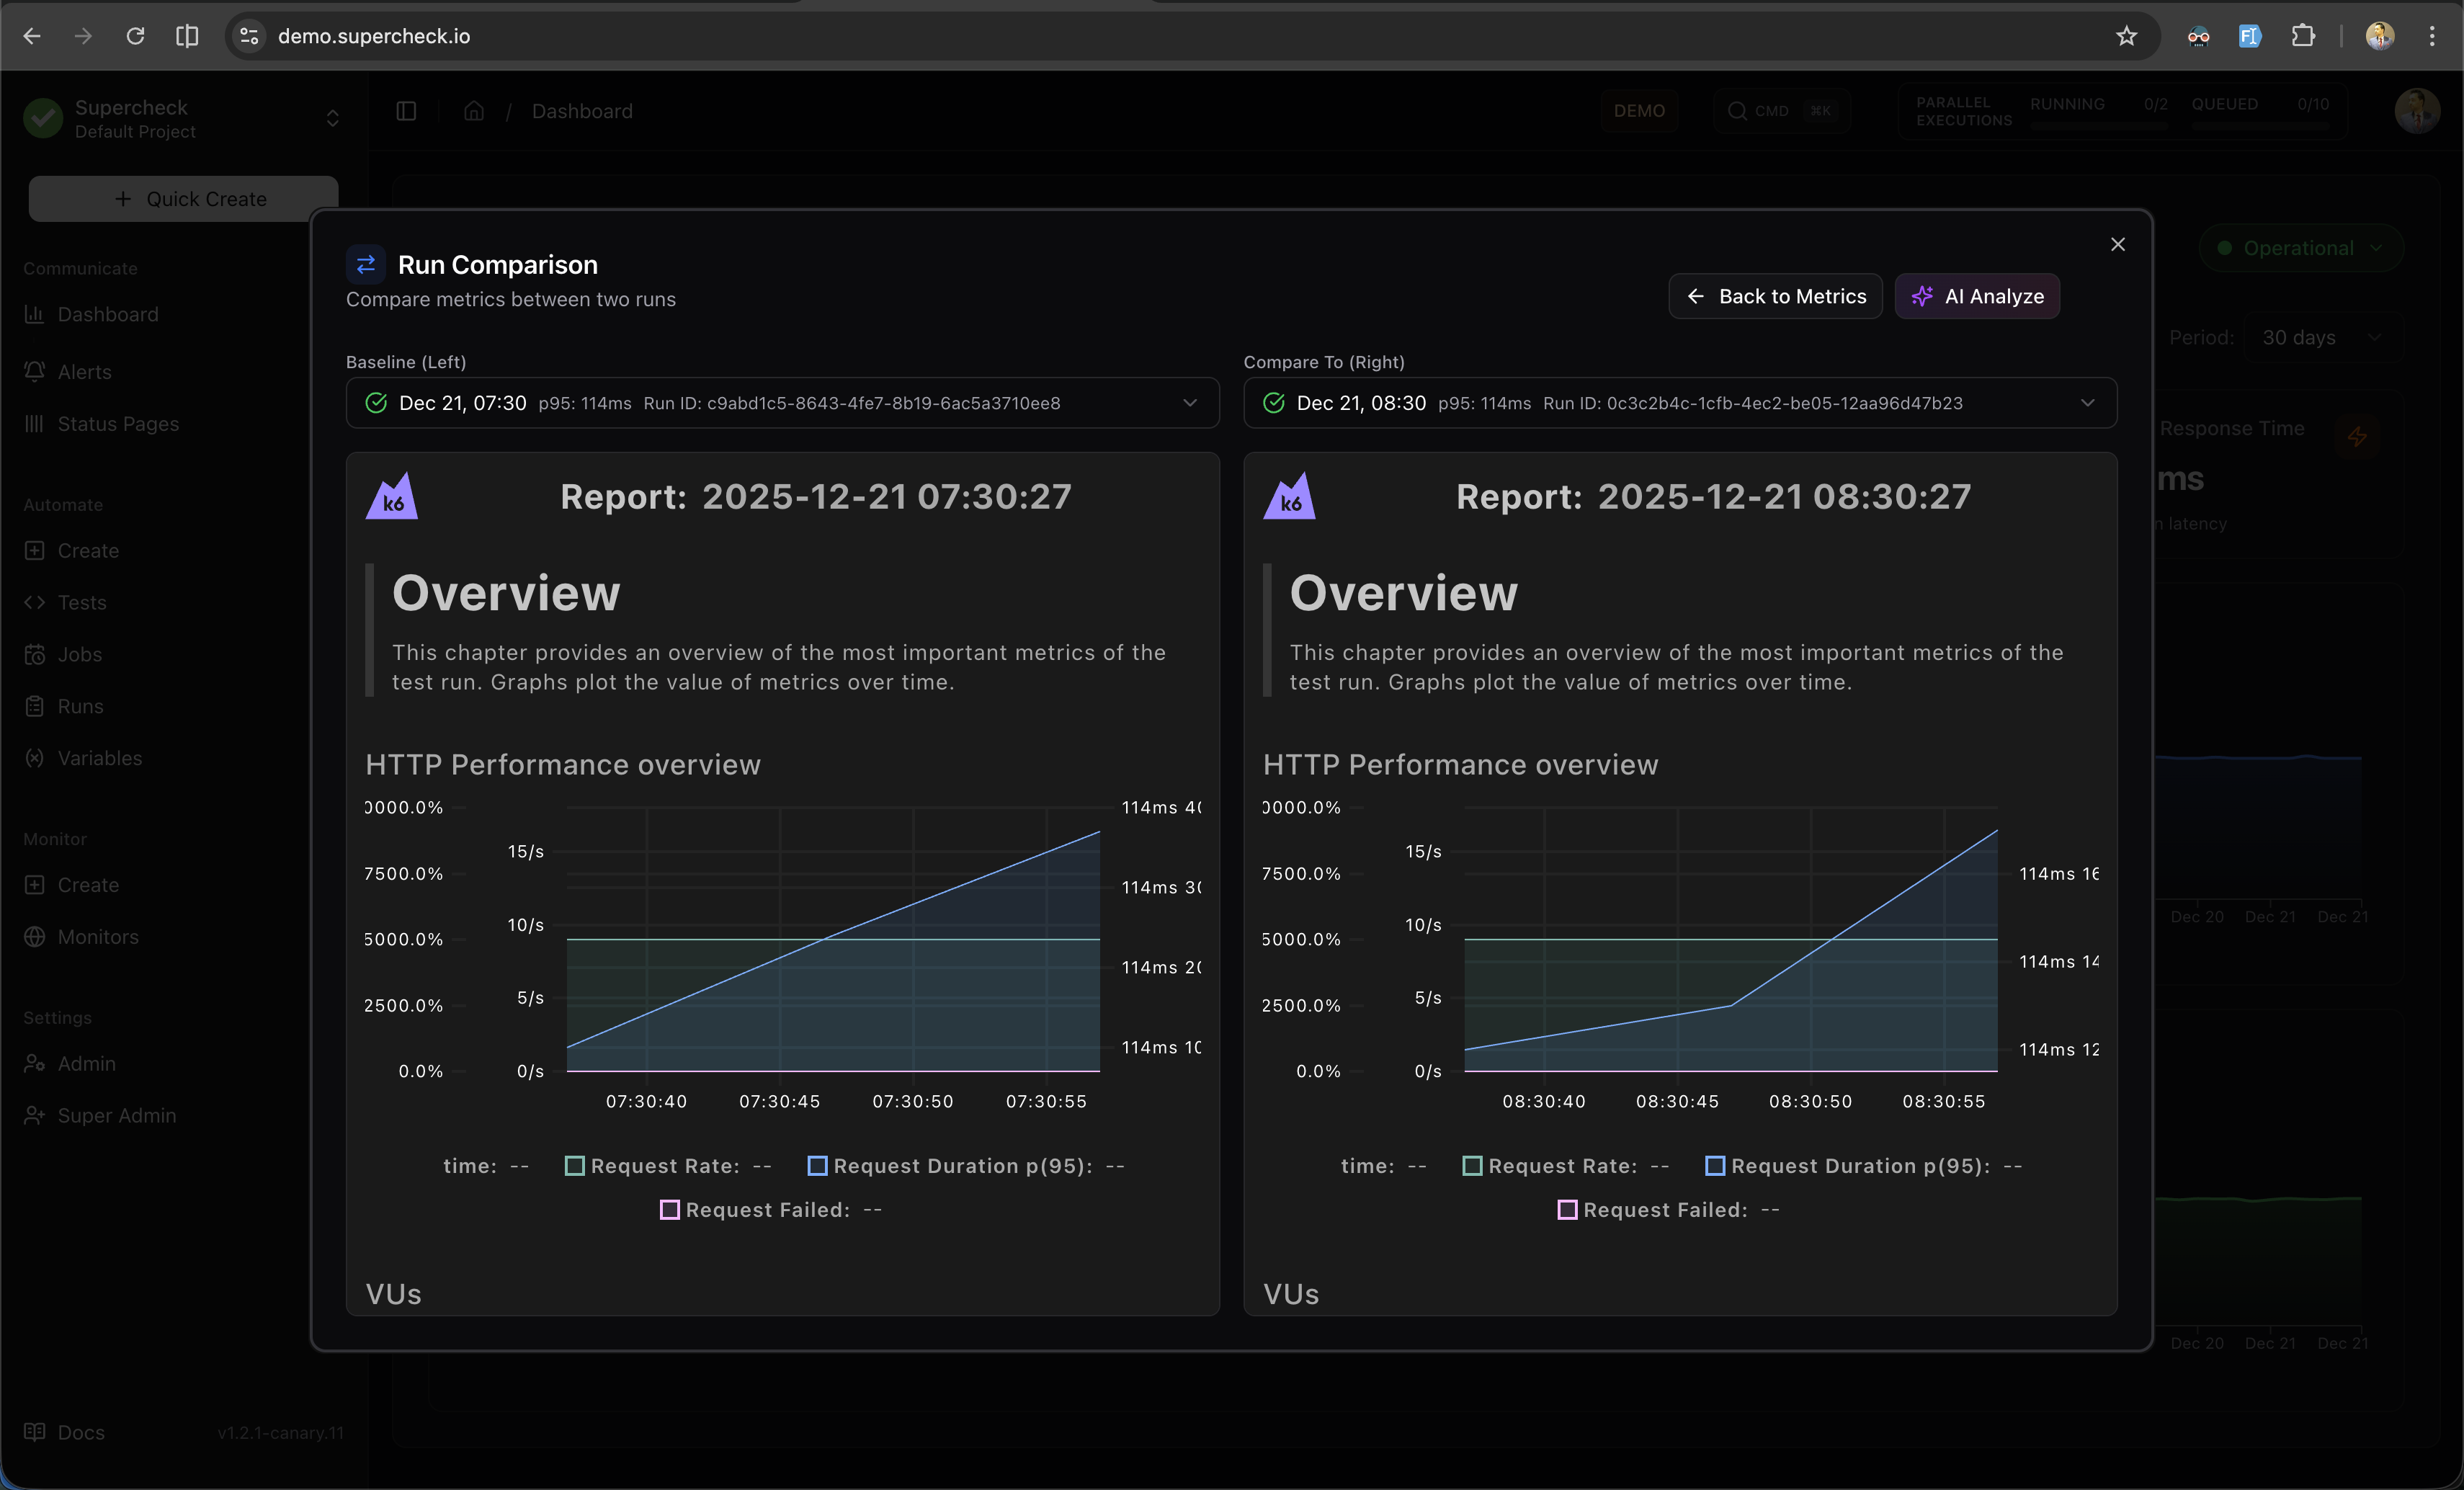
View k6 Reports
Click View k6 Reports to compare the detailed k6 HTML reports side-by-side.
AI Analyze
Click AI Analyze to generate an AI-powered performance comparison report.
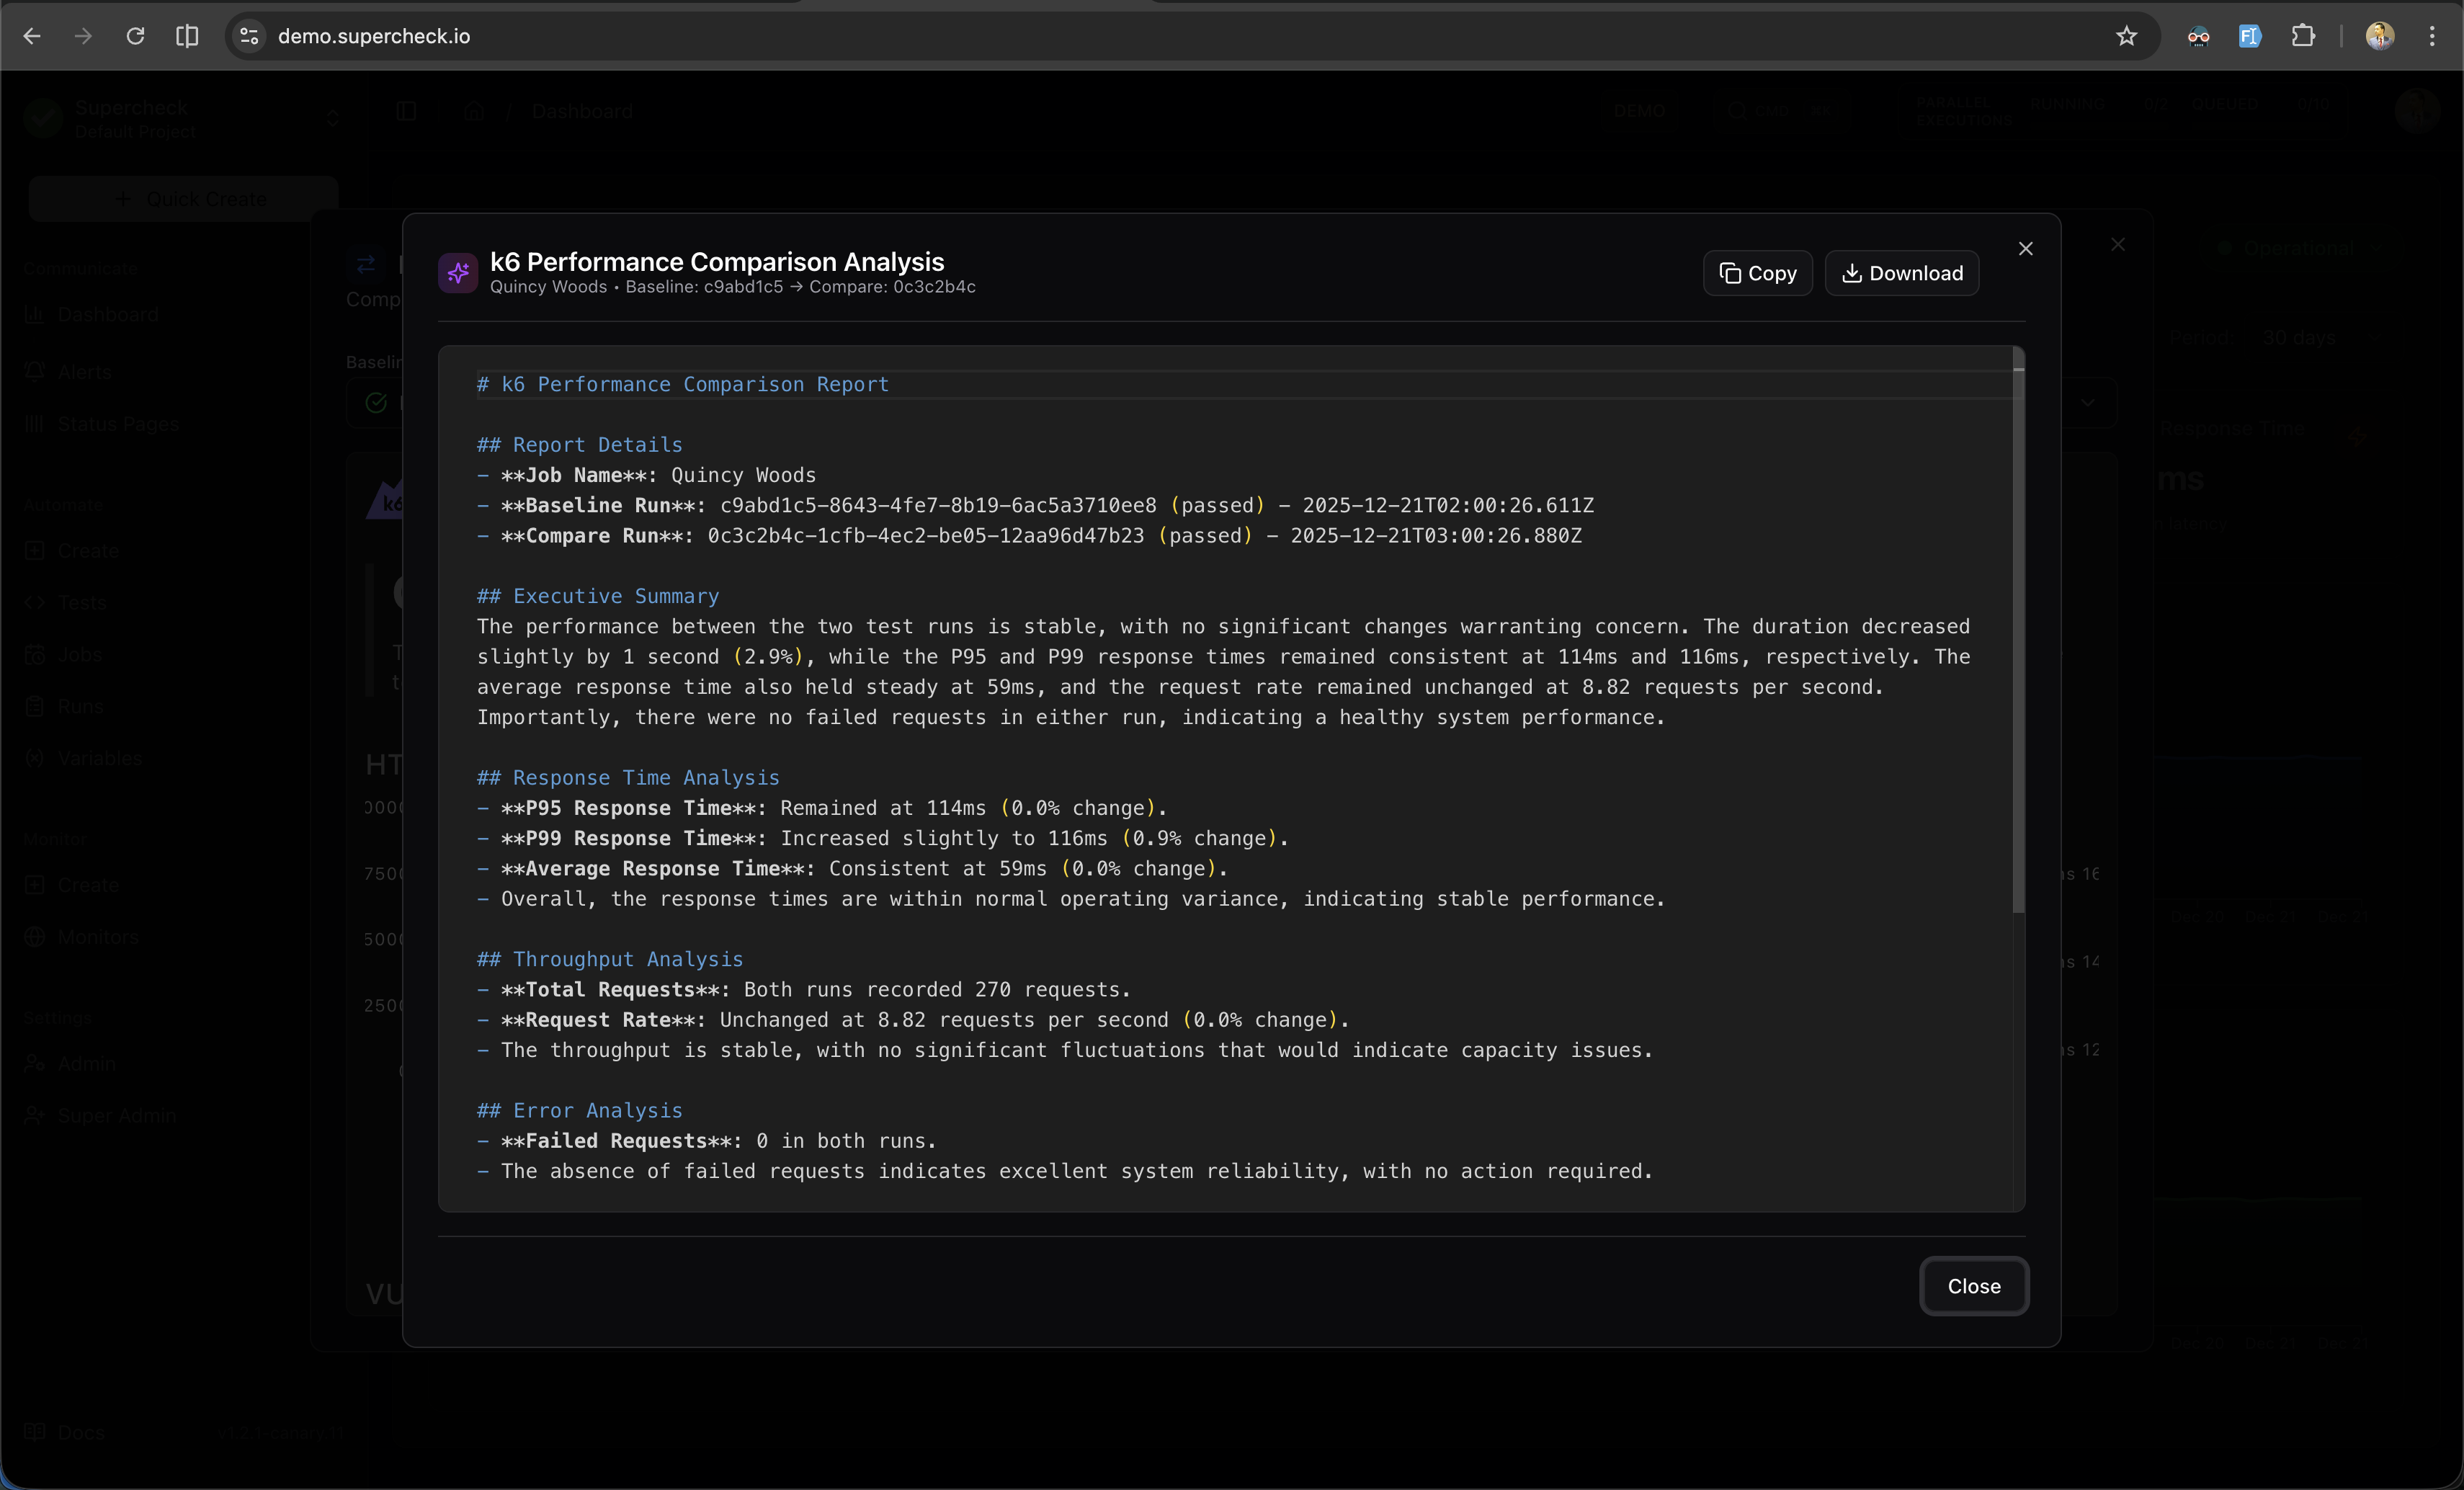
Features:
- Metric Comparison — Detailed analysis of response times and throughput
- Performance Insights — What improved and what regressed
- Potential Causes — AI-identified reasons for changes
- Recommendations — Actionable steps for improvement
AI Analyze requires an OpenAI API key configured in your environment.
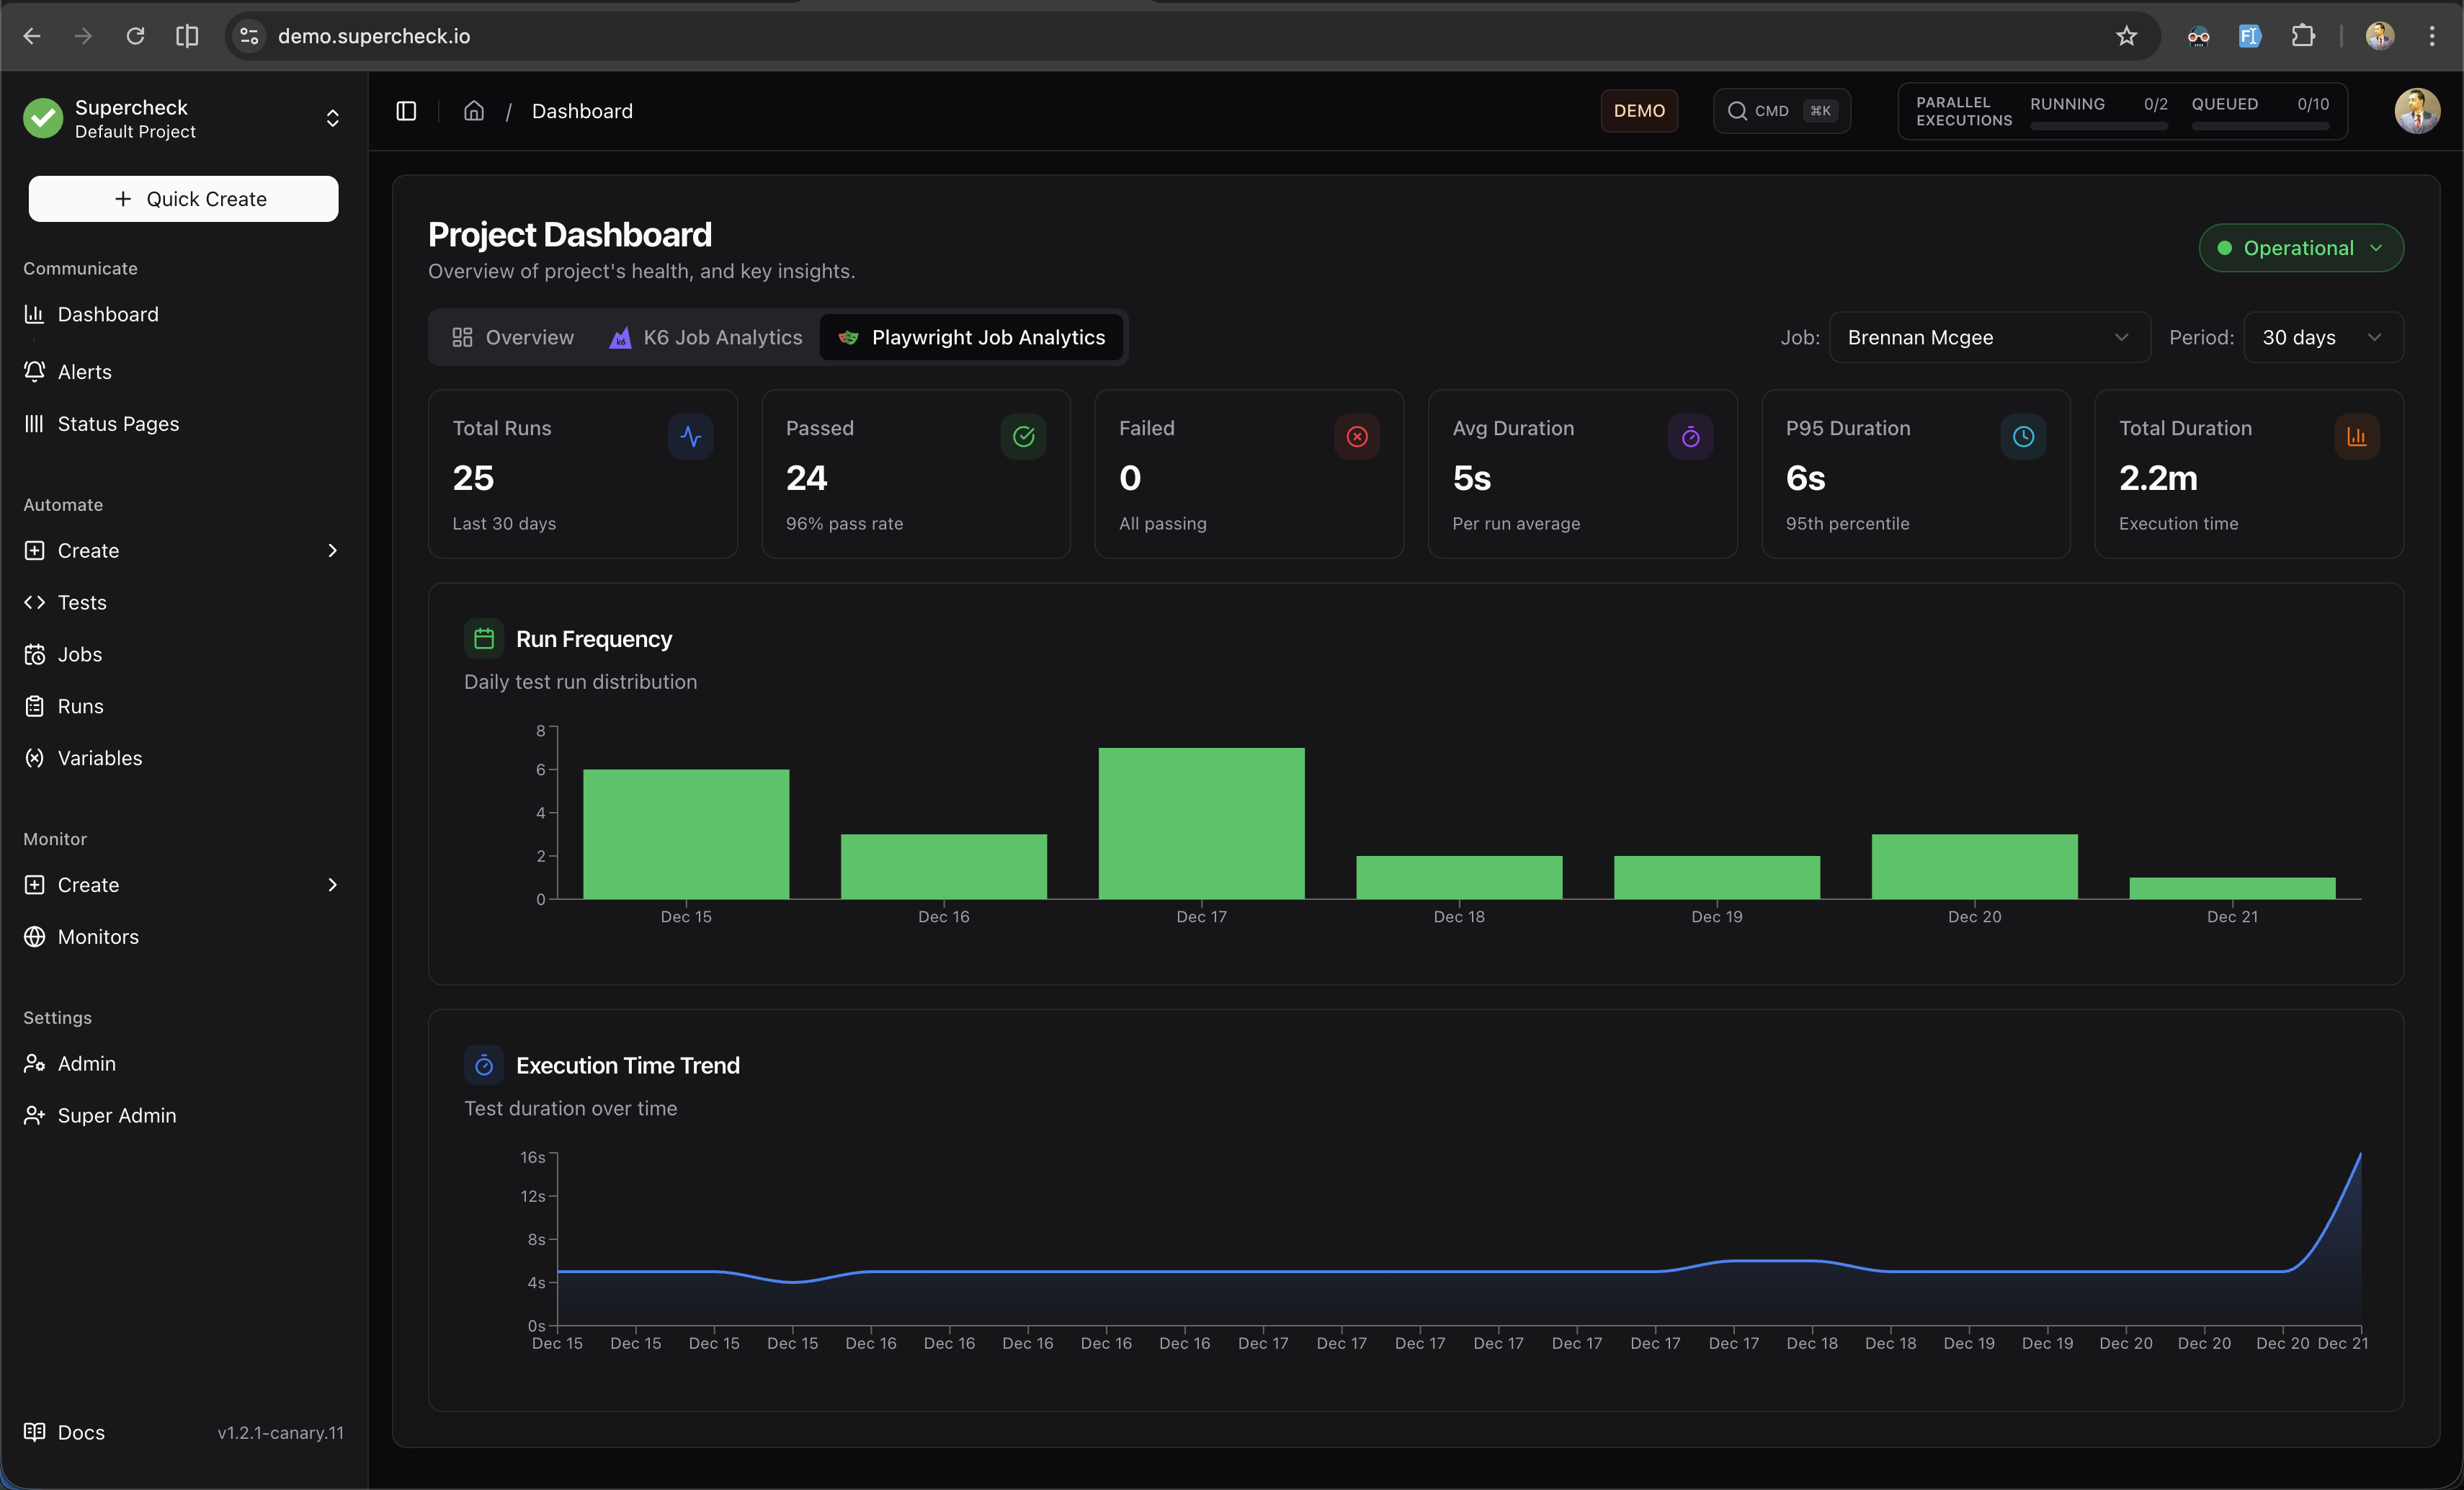
The Playwright Analytics tab provides insights into your browser test execution patterns and duration trends.
Filters
- Job — Filter to a specific Playwright job or view all jobs
- Period — Analyze last 30, 60, or 90 days of data
Metric Cards
| Metric | Description |
|---|---|
| Total Runs | Number of Playwright test executions in the selected period |
| Passed | Successful runs with pass rate percentage |
| Failed | Failed runs (highlighted if attention needed) |
| Avg / P95 Duration | Execution time statistics |
| Total Duration | Cumulative execution time in minutes |
Charts
Run Frequency
Stacked bar chart showing daily test run distribution (Passed vs Failed). Use this to identify testing patterns and failure spikes.
Execution Time Trend
Area chart showing test duration over time. Monitor for performance regressions, flaky tests, or infrastructure issues.